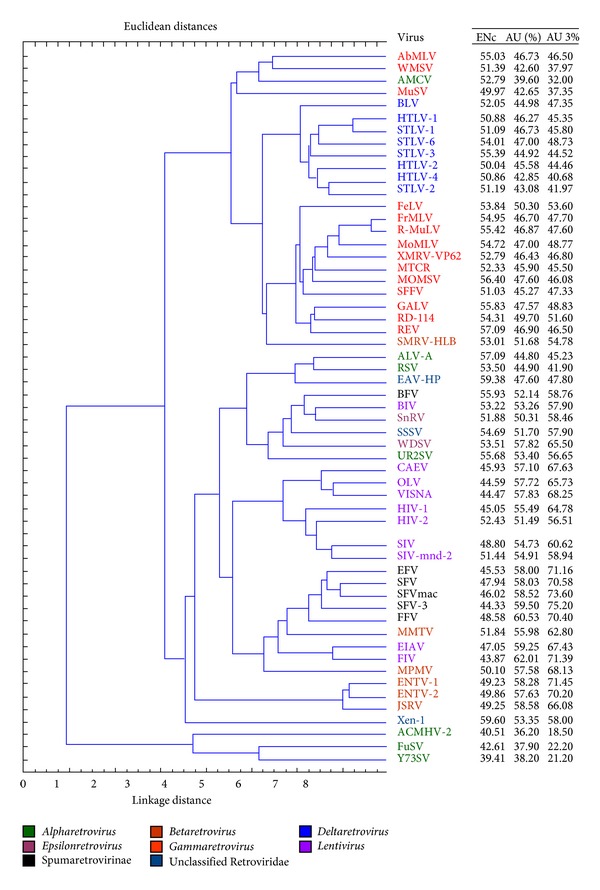
Figure 3.

Dendogram representing the extent of divergence in relative synonymous codon usage of 56 retroviruses, using unweighed pair group average clustering, and distances are in Euclidean distance. Different clades are in different colors. To the extreme right mean ENc, mean AU% and AU3% are added from Table 1.
