
Fig. 3.
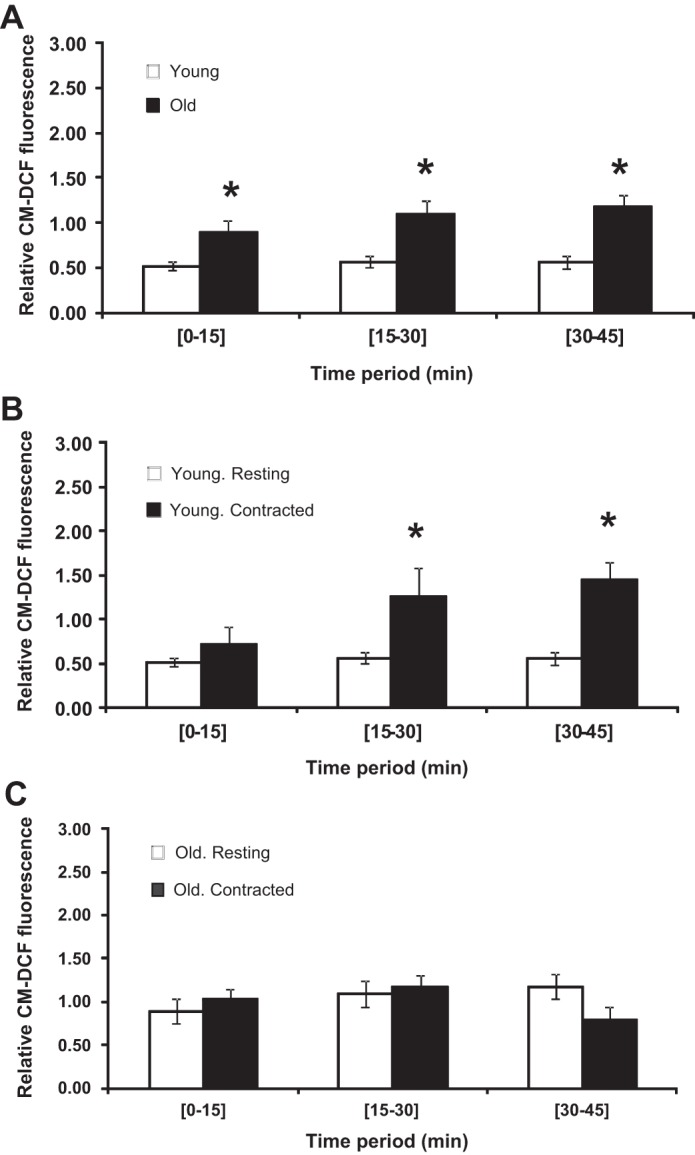
A: rate of change in 5-(and-6)-chloromethyl-2′,7′-dichlorodihydrofluorescein (CM-DCF) fluorescence in single quiescent FDB fibers from young and old mice. Data are presented as means ± SE. *P < 0.05 compared with values from fibers of young animals over the same time period, n = 15–16. B: rate of change in CM-DCF fluorescence in single FDB fibers from young mice that were either at rest throughout the experiment or subjected to a 15-min period of electrically stimulated contractions during the 15- to 30-min time period. Data are presented as means ± SE. *P < 0.05 compared with values from nonstimulated fibers over the same time period, n = 15–6. C: rate of change in CM-DCF fluorescence in single FDB fibers from old mice that were either at rest throughout the experiment or subjected to a 15-min period of electrically stimulated contractions during the 15- to 30-min time period. Data are presented as means ± SE. *P < 0.05 compared with values from nonstimulated fibers over the same time period, n = 16–13.