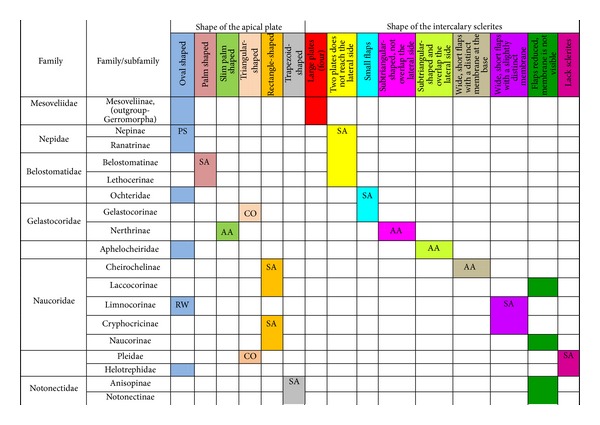
Table 3.
A map of the characters of the apical plate and intercalary sclerites (marked with various colors) indicates the common or individual characters for particular taxa. SA: synapomorphy, AA: autapomorphy, PS: plesiomorphy, RW: reverse, CO: convergence.

|
