Fig. 6.
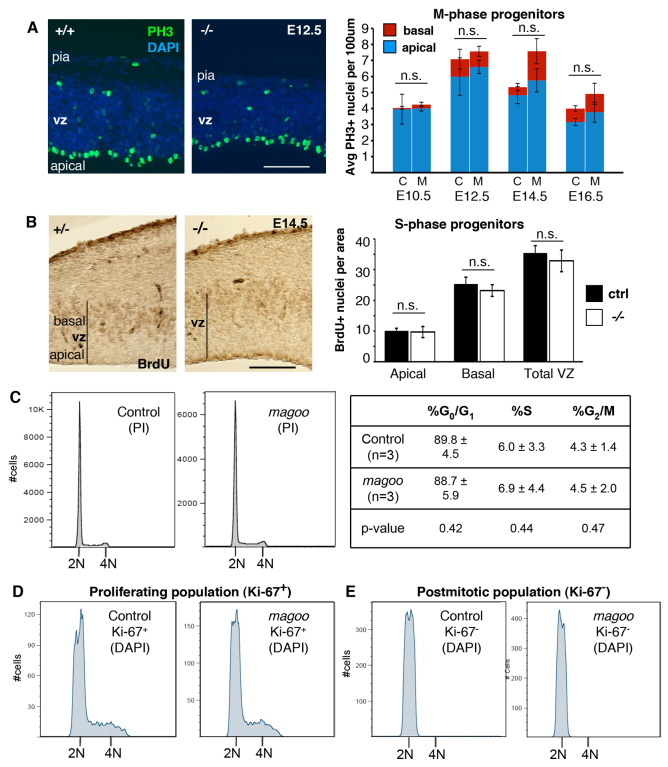
Mitotic parameters are similar in control and magoo mutant developing cortices. (A) (Left) Sections through control and mutant cortex stained with DAPI and immunostained for anti-phospho-histone H3 (PH3, green), a marker of cells in prophase through anaphase. Many PH3+ nuclei line the ventricle, indicating M-phase apical progenitors; the few PH3+ nuclei positioned basally represent basal progenitors. (Right) The average (± s.e.m.) numbers of apical and basal PH3+ nuclei per 100 μm length of ventricle were similar in control (C) and mutant (M) cortical sections. Number of brains for control (+/+, unless otherwise stated) and -/-: E10.5, 4 each; E12.5, 3 and 6; E14.5, 3 (2 +/+, 1 +/-) and 5; E16.5, 4 (2 +/+, 2 +/-) and 3. Two fields of several hundred microns were counted per brain. (B) (Left) Uptake of BrdU labels S-phase progenitors at the basal side of the ventricular zone (vz) in both control and mutant. (Right) The average (± s.e.m.) number of BrdU+ nuclei in the apical vz, basal vz, or total in a defined field (10,000 μm2). n=6 control (3 +/+, 3 +/-) and n=5 mutant fields. (C-E) No significant difference in DNA content was detected by flow cytometry in magoo mutant cortical cells. (C) DNA content of dissociated cells was analyzed by propidium iodide (PI) staining. The average percentage of cells in each cell cycle phase (± s.d.) is shown from three experiments. (D,E) The DNA content of neither proliferative (Ki-67+) nor postmitotic (Ki-67-, presumed neurons) cells differs in mutant cortices, with no evidence of tetraploidy. Histograms are representative of three independent experiments with pairs of E14.5 mutant and control cortices. Scale bars: 100 μm.

