Fig. 7.
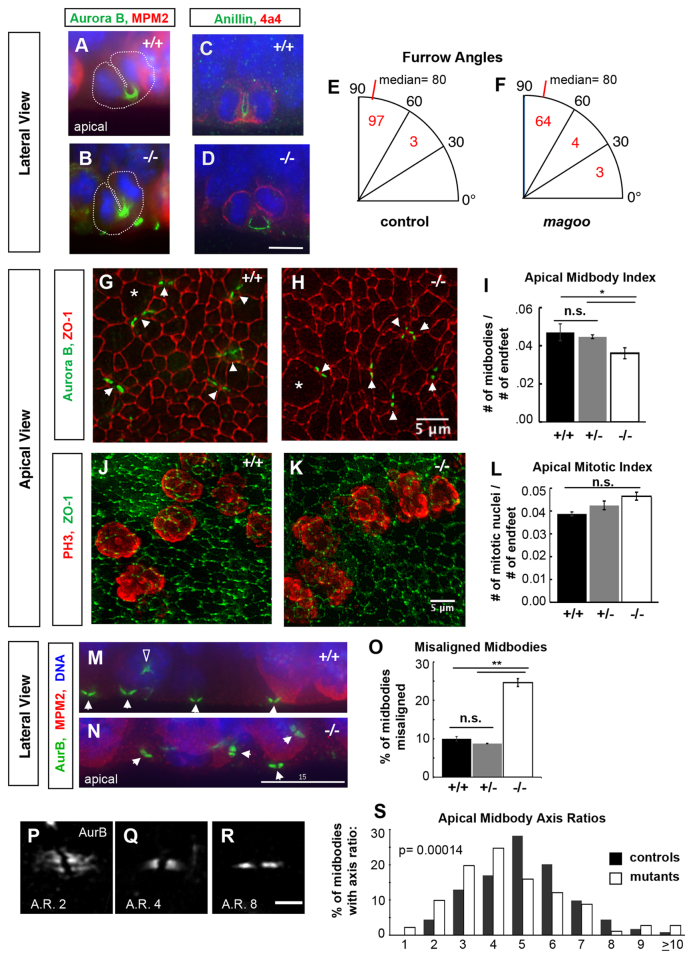
Cytokinetic cleavage furrows appear normal but midbodies are abnormal in apical progenitors of magoo mutant cortex. (A,B) Aurora B (green) localizes to microtubules within cytokinetic furrows in both control and mutant apical progenitors in E12.5 cortex. Cytoplasm is outlined with a dotted white line. MPM2 (red) marks the cytoplasm of prophase and metaphase cells strongly, anaphase weakly. (C,D) Anillin (green) labels the cleavage furrow membrane in both control (C) and mutant (D) apical progenitors. Phospho-vimentin (4a4 epitope, red) marks cells in prophase through anaphase. (E,F) Cleavage furrow angles are mostly vertical in both control and mutant apical progenitors in E12.5 cortex. Numbers of anaphase or telophase cells with a furrow angle (relative to the apical surface) in each bin are indicated. The angles had similar skewed distributions in controls and mutants (P=0.17, Kolmogorov-Smirnov test), each with a median of 80° (P=0.07, Mann-Whitney U-test), and most between 60° and 90° (P=0.19, chi-squared test). n=100 control cells (+/+ and +/-), n=71 mutant cells. (G,H) Apical views of the ventricular surfaces of cortical slab whole-mounts from E13.5 embryos, immunostained for ZO-1 (Tjp1; red) to outline apical endfoot junctions and aurora B (green, arrowheads) to mark cytokinetic midbodies. Apical endfeet enlarge for M phase (asterisks indicate examples) and shrink in G1/S. Images are maximum intensity projections of deconvolved 8-20 μm deep z-stacks. (I) The average (± s.e.m.) apical midbody index (number of midbodies per apical progenitor) is decreased in magoo mutant cortices compared with +/+ or +/- controls at E13.5. n=5 +/+, n=4 +/-, n=8 -/- hemispheres. *P<0.05 (when +/+ and +/- controls are pooled, P<0.01). (J,K) Apical surfaces of cortical slabs immunostained for phospho-histone H3 (PH3, red) to mark apical progenitors in prophase through anaphase, and for ZO-1 (green). (L) The average mitotic index (± s.e.m.) of apical progenitors is not significantly different in mutant cortex versus wild-type or heterozygous controls at E13.5 (P=0.08 and P=0.15). n=2 +/+, n=12 +/-, n=9 -/- hemispheres. (M,N) In control E12.5 cortical sections, most midbodies (white arrowheads) are aligned parallel to the ventricular surface, but in mutants many midbodies appear misaligned. The open arrowhead in M indicates aurora B in a prometaphase cell, not a midbody. Aurora B, green; MPM2, red; DAPI, blue. (O) The average percentage (± s.e.m.) of misaligned midbodies is significantly increased in mutant cortices compared with wild-type or heterozygous controls at E13.5. n=3 +/+, n=3 +/-, n=4 -/- cortices (∼150 midbodies examined per cortex). **P<0.01 (if +/+ and +/- controls pooled, P<0.0001). (P-R) Examples of aligned apical midbodies with different axis ratios (AR, length/width). Apical views of the ventricular surface labeled by aurora B; maximum intensity projections of 2 μm deep z-stacks. (S) Midbodies in magoo mutant cortices tend to have smaller axis ratios. Shown is the percentage of midbodies with a given axis ratio in control and magoo mutant E13.5 cortices. Bin 1 includes ratios of 1.0 to 1.9, bin 2 includes 2.0-2.9, etc. Only midbodies aligned with the apical surface were measured. Mutants and controls had remarkably different axis ratio medians (4.7 versus 5.5; P=1.4×10⁻⁴, Mann-Whitney U-test) and distributions (P=2.5×10⁻⁵, Komogorov-Smirnov test). +/+ and +/- controls had similar distributions (P=0.71, Kolmogorov-Smirnov test) and medians (5.5 and 5.6; P=0.53, Mann-Whitney U-test), so they were combined in this histogram for visual clarity. n=117 +/+ and n=106 +/- control midbodies from 2 cortices each; n=182 midbodies from 4 -/- cortices. Scale bars: 7.5 μm in D; 5 μm in H,K,R; 15 μm in N.

