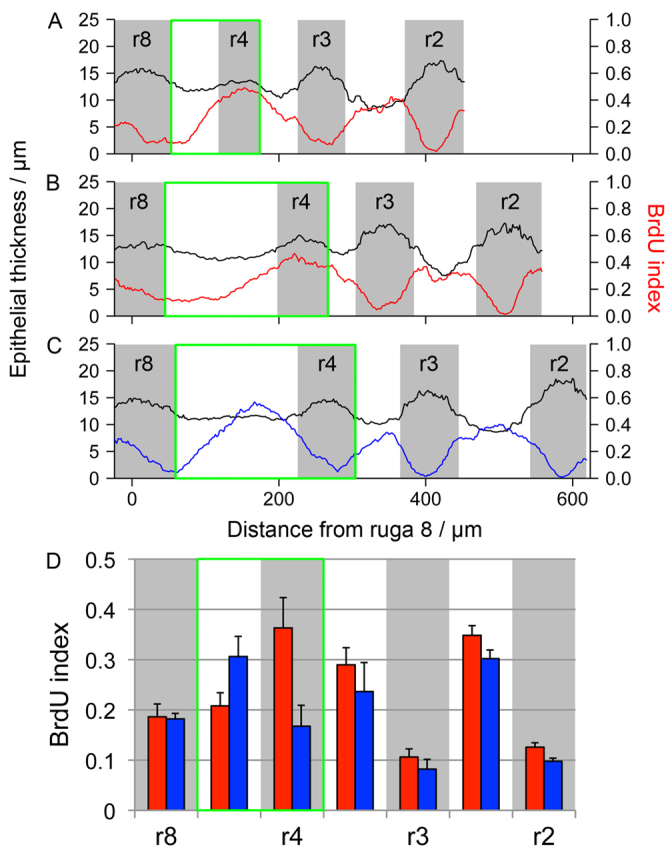
Fig. 3.

Ruga formation is associated with elevated proliferation. (A-C) Line graphs of epithelial thickness (black line, left-hand scale) and local BrdU incorporation (red/blue lines, right-hand scale) along the AP axis showing ruga 4 (r4) forming in a series of three closely aged E13.5 specimens (positions of rugae marked in grey). In younger specimens (A,B), BrdU incorporation is high in r4, whereas in the older specimen (C) BrdU incorporation is lower in r4 but high more posteriorly. (D) Histogram of BrdU index in rugal (grey) and inter-rugal (white) regions in three younger specimens (red) compared with three older specimens (blue). Error bars represent s.d. In all plots, the GZ is marked by a green box.
