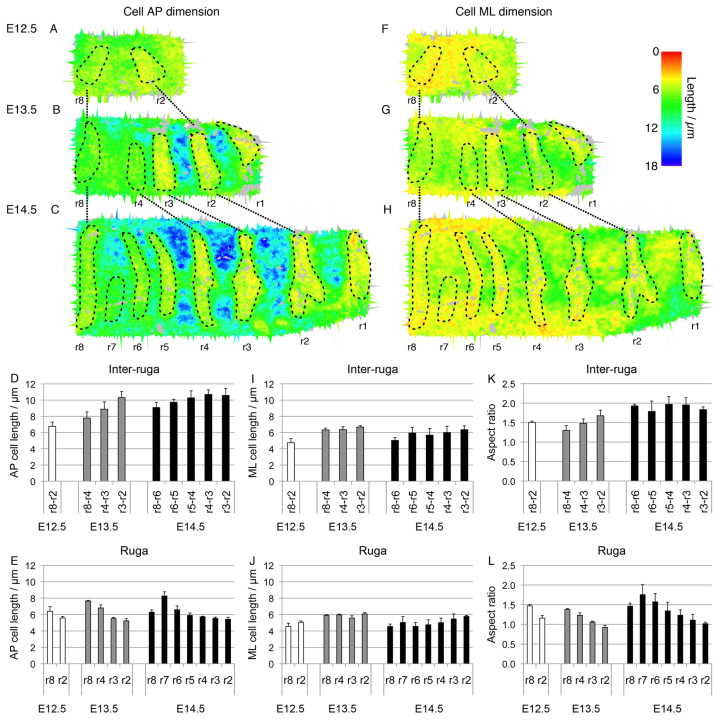
Fig. 6.
The epithelial GZ is a region of cell elongation. (A-C) Maps of AP cell length at E12.5 (A), E13.5 (B) and E14.5 (C) showing cell elongation in inter-rugal regions of the palate (anterior to the right, medial at the top) where tissue elongation is occurring, and cell shortening in the rugae. Maps were smoothed by averaging measurements over each cell and its immediate neighbours. (D,E) Histograms of average AP cell length across inter-rugal regions (D) and rugae (E) (rugae bounded as marked on maps) summarising this pattern. (F-H) Maps of ML cell length at E12.5 (E), E13.5 (F) and E14.5 (G) showing a small increase in ML cell length with tissue growth between E12.5 and E13.5, but little ML growth between E13.5 and E14.5, and little change in ML cell length in the rugae either. (I,J) Histograms averaging ML cell length across inter-rugal regions (I) and rugae (J) summarising this pattern. (K,L) Histograms of average cell aspect ratio across inter-rugal regions (K) and rugae (L). Inter-rugal AP increase is associated with an increase in AP/ML aspect ratio (K). Ruga maturation is associated with cells becoming more isotropic (L). For each interval in histograms (D,E,I-L), spacing calculated across three palates. Error bars represent s.d.

