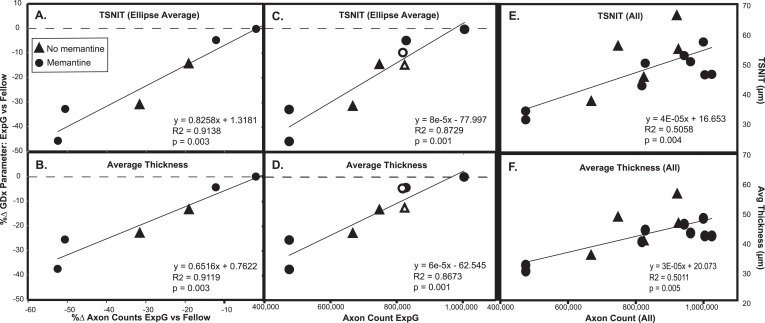
Figure 2.
TSNIT or average thickness changes in ExpG compared with Fellow eyes as a function of axon counts. Common GDx measures were highly correlated with percent change (%Δ) in axon counts in ExpG versus Fellow eyes (A, B) and with actual axon counts in ExpG eyes (C, D). The absolute value of GDx measures considering all eyes was also correlated with axon counts (E, F). Similar correlations were found with other GDx measures (superior average and inferior average). More axon count values were available for ExpG eyes than for Fellow eyes (open symbols indicate ExpG eyes where there were no corresponding Fellow eye axon counts, also see Table 4).

