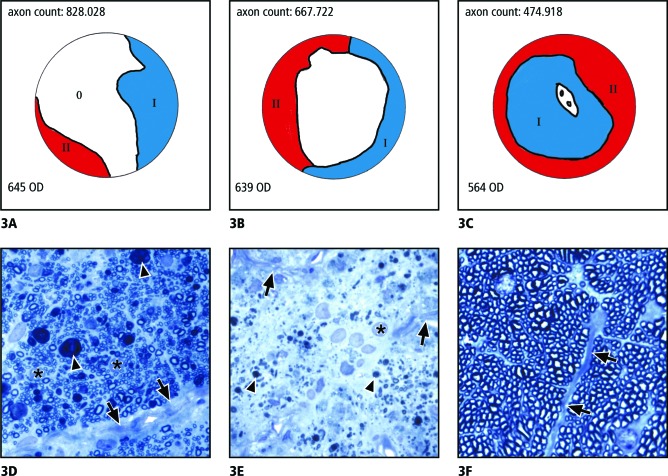
Figure 3.
Morphology of optic nerve damage as a result of ExpG. (A–C) Schematic drawings showing typical distributions of severely damaged (red), slightly damaged (blue), and histologically unchanged (white) areas in eyes with axon counts of (A) approximately 800,000; (B) approximately 500,000 to 600,000; and (C) approximately 400,000–500,000. (D–F) Semithin cross-sections of optic nerves (Richardson's stain). (D) Micrograph of a less damaged area (blue areas in the schematic drawings A–C). The nerve fiber bundles are still separated from each other by connective tissue septae (arrows), which, at places, are thickened and show a thickened sheath of glial cells (asterisks). Singular axons are destroyed and appear as spherical inclusions of myelin figures (arrowheads). (E) Micrograph of a severely damaged area (red areas in the schematic drawings A–C). Parts of the connective tissue septae appear destroyed (arrows) and displaced by numerous cells with large nuclei (asterisk). In the region of the previous bundles, remnants of myelin (arrowheads) are present. (F) Normal unaffected region of a nerve with the nerve fiber bundles separated from each other by connective tissue septae (arrows).

