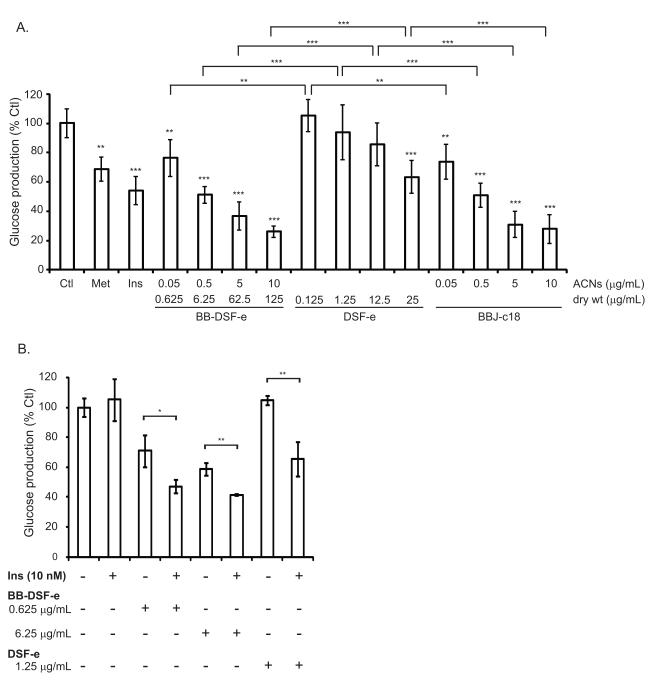
Figure 4.
BB-DSF-e and DSF-e repress glucose production in H4IIE cells. (A) Release of glucose from starved control cells treated with medium alone (Ctl) was set as 100% glucose release. Triplicate wells of cells were treated with 2 mM metformin (Met), 50 nM insulin (Ins) or the indicated amounts of BB-DSF-e, DSF-e and BBJ-c18. The BB-DSF-e and BBJ-c18 samples were normalized to deliver equivalent amounts of anthocyanins (ACNs) as indicated. The dry weight amounts of DSF-e delivered was 20% of the amount of BB-DSF-e delivered. Bars represent mean ± SD (n=6) of data combined from two independent experiments performed in triplicate. Asterisks directly above each bar represent significant difference relative to Ctl as determined by ANOVA followed by Dunnett’s test (* p< 0.05; ** p< 0.01; *** p< 0.001). Asterisks above graph represent differences between indicated pairs of BB-DSF-e and DSF-e samples as well as differences between pairs of DSF-e and BBJ-c18 samples, as determined by T-test (2-tailed): * p< 0.05; ** p< 0.01; *** p< 0.001. (B) Triplicate wells of cells were treated with medium only or the indicated doses and combinations of 10 nM insulin (Ins), BB-DSF-e, or DSF-e. Bars represent mean ± SD (n=3) of data from triplicate samples. Asterisks above graph represent differences between treatment in the absence or presence of 10 nM insulin, as determined by T-test (2-tailed): * p< 0.05; ** p< 0.01. As detailed in text, BB-DSF-e and DSF-e refer to the C-18 SPE column-purified eluates produced from BB-DSF or DSF; BBJ-c18 refers to a C-18 SPE column-purified blueberry juice.

