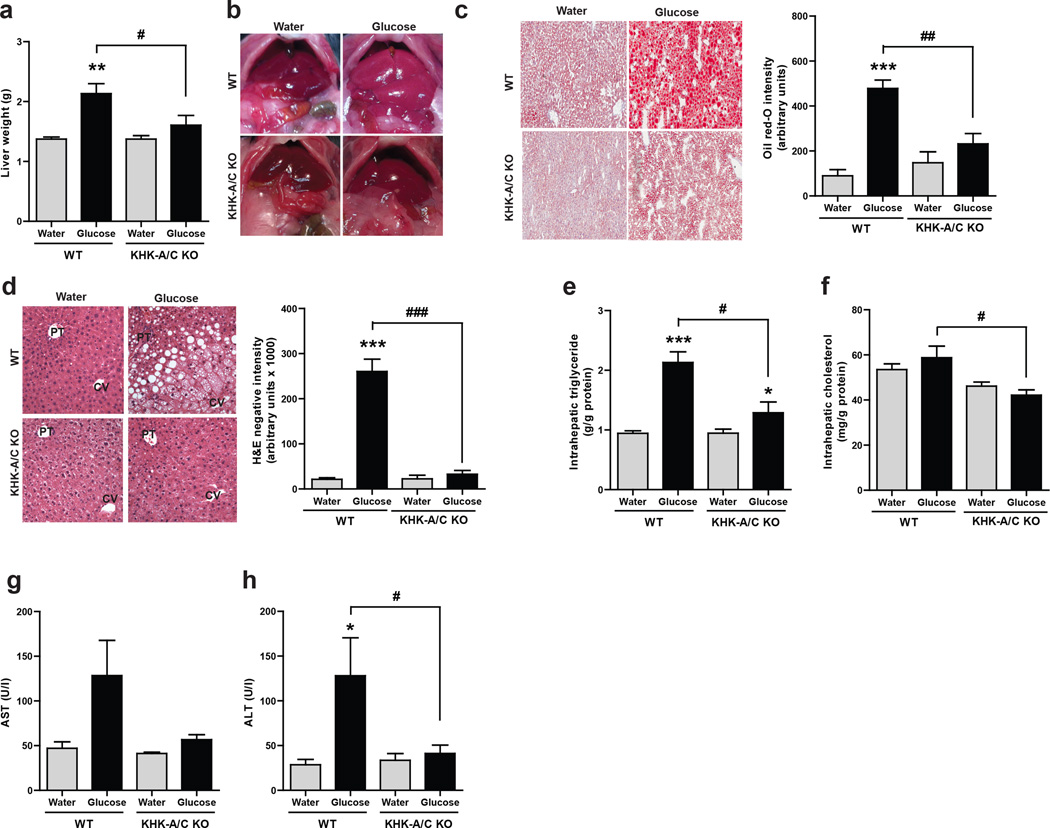
Figure 2. Effect of Glucose consumption on Liver histology and function.
WT mice and KHK-A/C KO mice were given 10% glucose water, or tap water for 14 weeks with normal chow diet ad libitum (n = 6 per group). (a) Liver weight. (b) Gross images of liver showing increased liver size and pale color in WT but not KHK-A/C KO mice given glucose (size bar: 1 cm). (c) Representative images of oil red O staining demonstrating increased fat accumulation (red) in WT but not KHK-A/C KO mice given glucose. (size bar 50 µM) (d) Representative images of H and E staining showing areas of macrosteatosis (white vesicles) in zone 2 and microsteatosis in zone 1 (surrounding the central vein, CV) in WT but not KHK-A/C KO mice given glucose, PT: Portal Triad. (e) Intrahepatic triglyceride levels. (size bar 50 µM) (f) Intrahepatic cholesterol levels. (g) Serum aspartate aminotransferase (AST) levels. (h) Serum alanine aminotransferase (ALT) levels. Data represent means ± S.E.M. *P < 0.05, **P < 0.01, ***P < 0.001 vs. respective water control. #P < 0.05. ##P < 0.01. ### P < 0.001. (ANOVA, Tukey post hoc)

