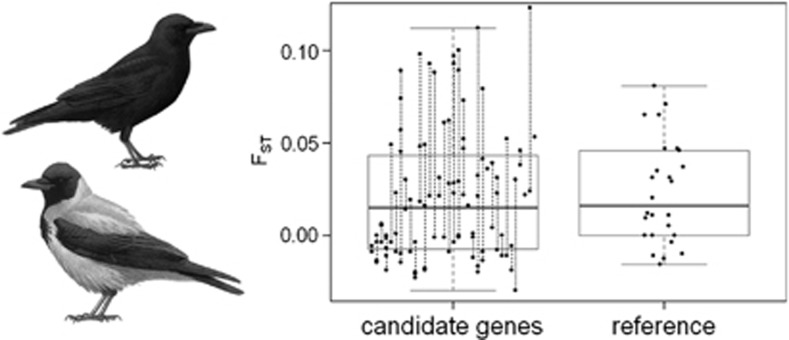
Figure 1.
Genetic differentiation between carrion crows (all-black) and hooded crows (grey-coated). Boxplot of FST-values across 107 amplicons (dots) derived from 37 candidate genes, with vertical lines connecting amplicons from a single gene. Twenty-five random sequences from non-colour-related genes are given as a reference. Boxes include the second and third quantile; whiskers extend to the most extreme data points that lie within 1.5 times the interquartile range from the box. On the left hand side: a hooded crow (bottom) and a carrion crow (after Mullarney et al. 1999).

