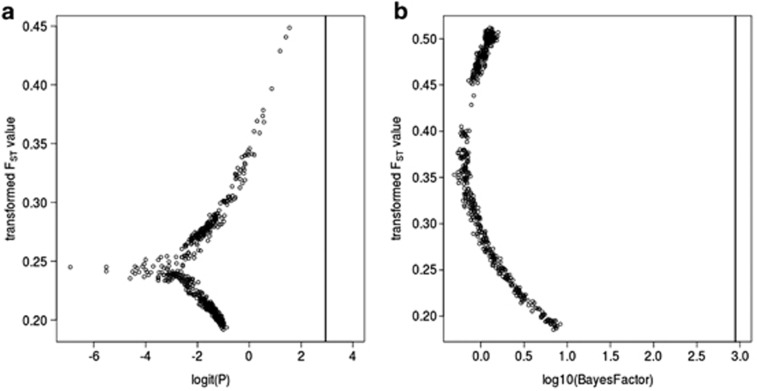
Figure 2.
Results of FST outlier differentiation tests with bayesFst (a) and bayeScan (b). In both panels, the transformed FST-value for each SNP is shown, with transformed p-values on the x axis, and a vertical bar indicating significance equivalent to P=0.05. The logit function in panel (a) is logit(x)=log(x/(1−x)), see Beaumont and Balding (2004).

