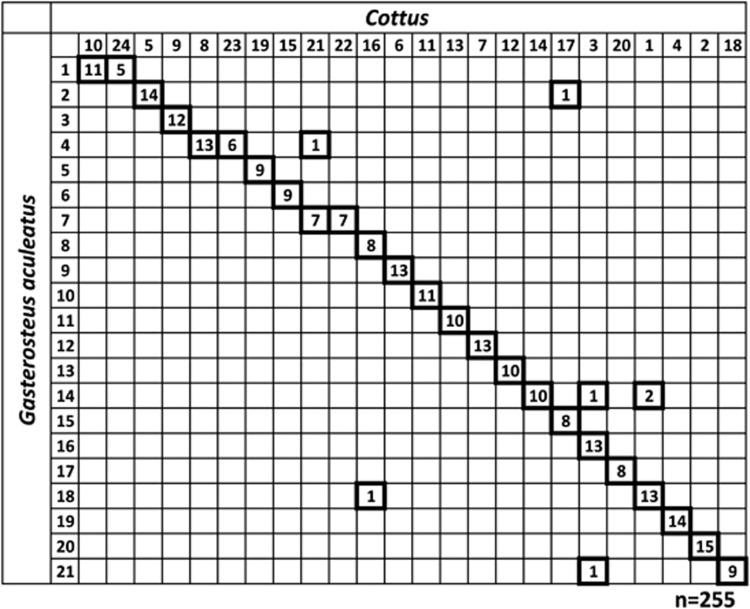
Figure 2.
Oxford grid of synteny relationships between Cottus linkage groups (x-axis) and stickleback chromosomes (y-axis) based on BLAST mapping of Cottus EST contigs. Numbers in fat squares indicate shared markers among genetic regions. Six instances of possible interchromosomal rearrangements were noted, and chromosomal fusion events are suggested for stickleback chromosomes 1, 4 and 7.

