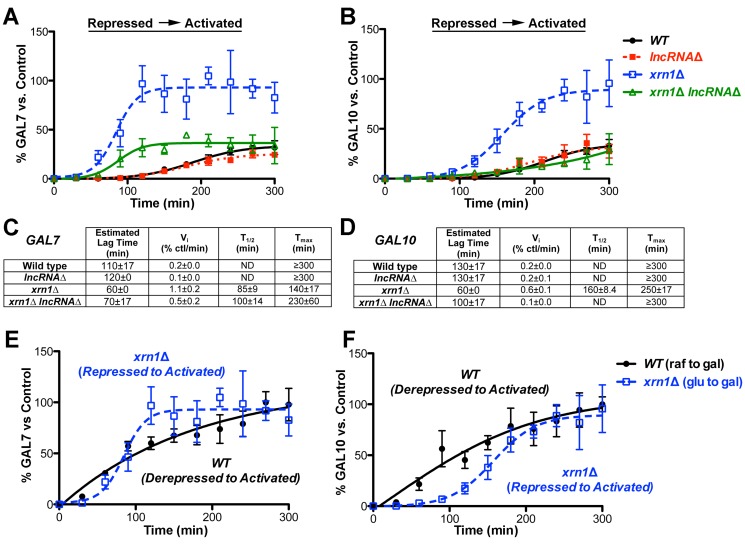
Figure 6. The GAL lncRNAs enhance the kinetics of transcriptional induction from repressed conditions in xrn1Δ cells.
(A–B) Rapid induction of GAL7 (A) and GAL10 (B) transcripts in xrn1Δ cells is lncRNA-dependent. Transcriptional induction of isogenic wild-type (closed black circle), lncRNAΔ (closed red square), xrn1Δ (open blue square), and xrn1Δ lncRNAΔ (open green triangle) strains induced from repressed conditions (+glucose) was analyzed as above to determine lag times, initial velocities, and final levels. Note that the transcript abundance is reported as a percentage of the fully induced “control” as in Figure 5, illustrating that wild-type cells are not fully induced at the end of this time course. Representative northern blots are shown in Figure S2. (C–D) GAL7 (C) and GAL10 (D) transcriptional induction kinetic profiles illustrate lncRNA-dependent kinetic enhancement from repressed conditions. Kinetic parameters were determined as in Figure 5. Strains that did not reach an induction plateau within the 300 min time frame display Tmax values that are equal to or greater than 300 min. In these cases, half-times (T1/2) were not determined (ND). (E–F) The lncRNA-dependent enhanced induction in xrn1Δ cells parallels wild-type induction from a derepressed state. Transcriptional profile overlay of GAL7 (E) and GAL10 (F) induction in wild-type cells (closed black circle) from derepressed to activated conditions as compared to xrn1Δ cells (opened blue square) from repressive conditions.

