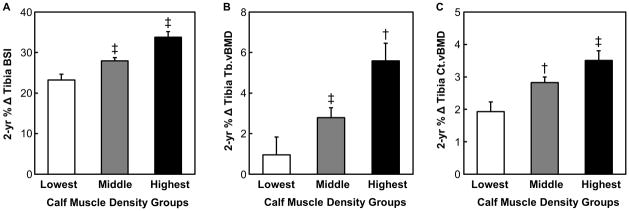
FIGURE 1.

Two year percentage change in A) bone strength index (BSI, mg2/cm4) B) trabecular volumetric bone mineral density (Tb.vBMD, mg/cm3), and C) cortical volumetric bone mineral density (Ct.vBMD, mg/cm3) of the tibia for the lowest, average of the middle 3 (middle), and the highest fifths of 2-year change thigh in muscle density (mg/cm3). A linear mixed effects model was used to evaluate differences in bone parameters among the 3 groups (see “Statistical analysis” section). * P < 0.05 versus the lowest group; † P < 0.01 versus the lowest group; ‡ P < 0.001 versus the lowest group.
