
Figure 2.
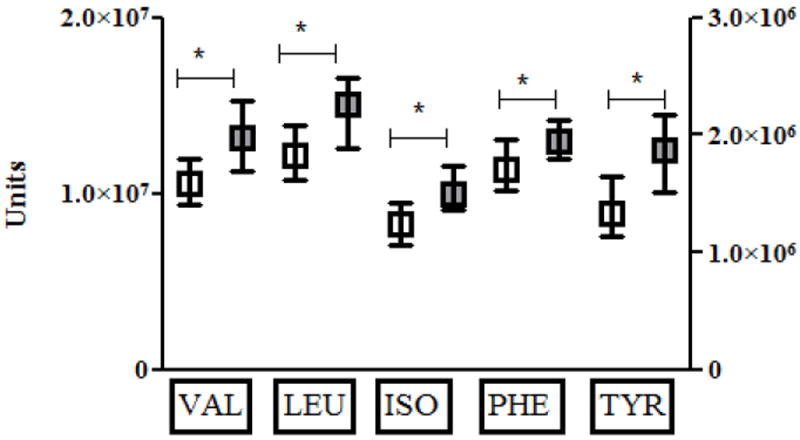
Shown are median (box) and interquartile range (whiskers) for insulin sensitive (IS, white) and insulin resistant subjects (IR, gray) for valine (VAL), leucine (LEU), isoleucine (ILE), phenylalanine (PHE), and tyrosine (TYR) at baseline prior to interventions. Values are in arbitrary units on the left Y-axis for all amino acids except TYR, which are provided in arbitrary units on the right Y-axis. Statistically significant comparisons are marked by asterix and connecting bar.