
Figure 4.
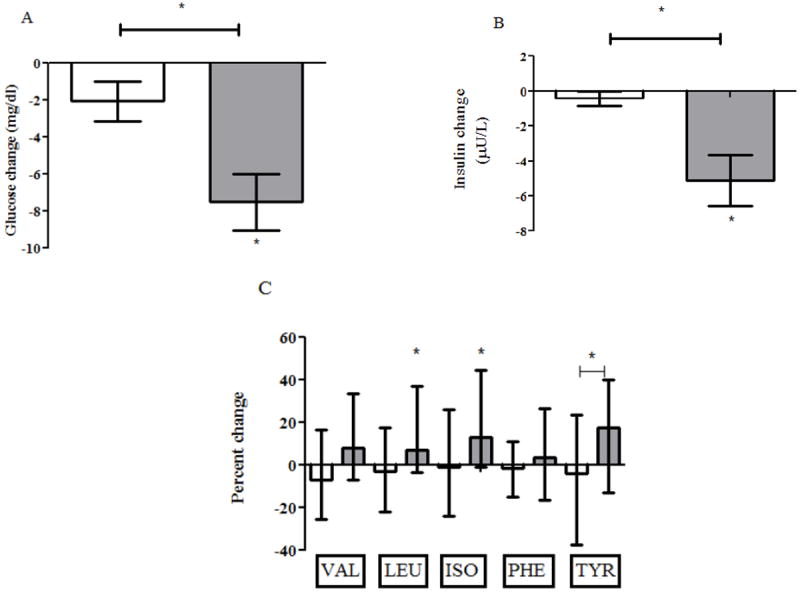
Shown are median and interquartile ranges for change in glucose (panel A), change in insulin (panel B), and percent change in BCAA/AAAs (panel C) during the metformin intervention. Results for insulin sensitive (IS) participants are shown as white bars, and results for insulin resistant (IR) participants are shown as gray bars. Statistically significant changes are marked by asterix and statistically significant comparisons are marked by asterix and connecting bar.