
Figure 5.
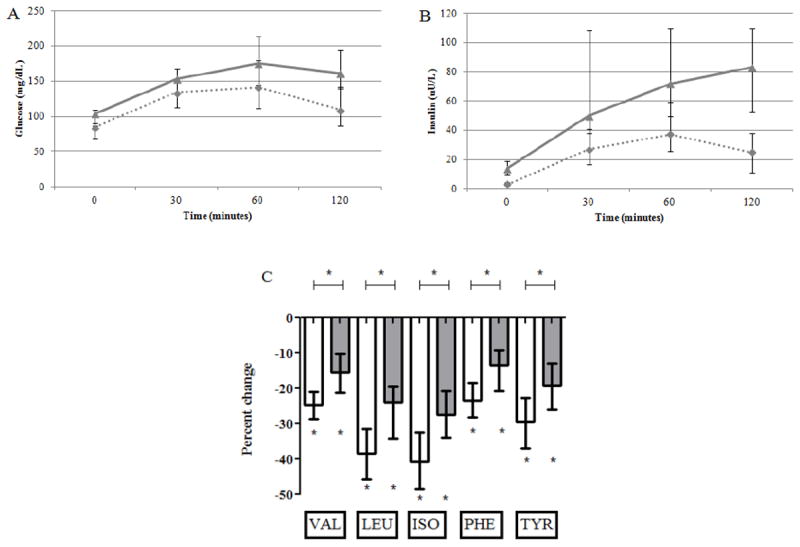
Shown are median and interquartile ranges for glucose (panel A), insulin (panel B), and percent change in BCAA/AAAs (panel C) during the OGTT intervention. Results for insulin sensitive (IS) participants are shown as dashed lines (panels A and B) or white bars (panel C), and results for insulin resistant (IR) participants are shown as gray lines (panels A and B) or gray bars (panel C). Statistically significant changes are marked by asterix and statistically significant comparisons are marked by asterix and connecting bar.