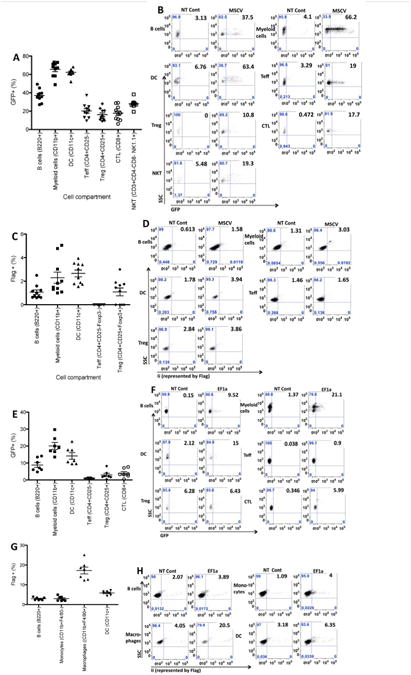
Fig. 4.

In vivo expression of GFP and Ii derived from MSCV or EF1a-transduced HSC. GFP levels (A & B from MSCV; E & F from EF1a) and Ii levels (represented by Flag, C & D from MSCV; G & H from EF1a) were assessed in various cell compartments in blood from NOD mice 4w post-transplantation of HSC. MSCV (A to D) or EF1a (E to H) viruses at MOI=80 were used to transduce donor HSC, which were then transplanted into lethally irradiated recipients. A & C (n=10) and E & G (n=7) summarize data from multiple mice. B & D are representative FACS graphs from one non-transplanted (NT) control and one MSCV lentivirus-transduced mouse. F & H are FACS graphs from another NT control and one EF1a-transduced mouse. Cell markers for each lineage are indicated in parentheses. Note the maximal number on y axis of panel C is 6%.
