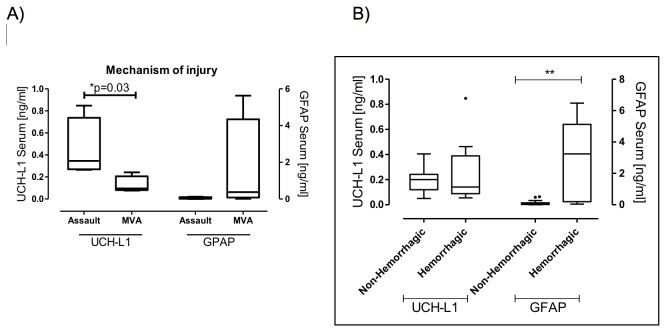
Figure 3. Box-and-whisker plots demonstrating UCH-L1 and GFAP concentrations.
(A) Serum UCH-L1 and GFAP concentrations in patients who were victims of assault and in patients injured in a MVA. (B) Serum UCH-L1 and GFAP concentrations in patients with ventricular hemorrhages and hemorrhagic contusions and in patients with non-hemorrhagic lesions. The black horizontal line in each box represents the median, with the boxes representing the interquartile range. Significant differences are indicated * (P< 0.05) or ** (P <0.01) (Mann–Whitney U-test).

