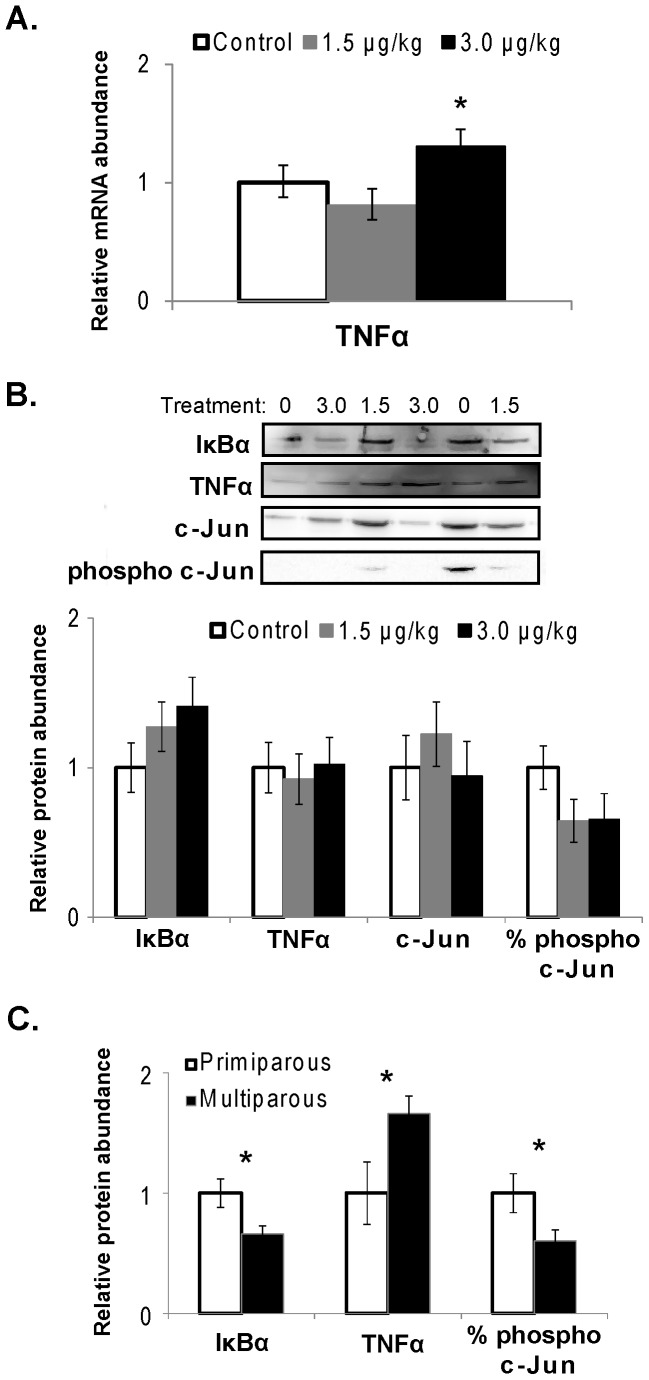
Figure 3. Hepatic mRNA abundance of TNFα and protein abundance of key mediators involved in inflammatory pathways.
Liver samples were collected after 7 days of rbTNFα or Control administration. (A) Hepatic TNFα transcript abundance was increased by 3.0 vs. 1.5 µg/kg rbTNFα treatments (P = 0.02), but did not differ between rbTNFα treatments and Control (P = 0.73). (B) Western blot images are shown for 6 cows along with densitometry data from analysis of all samples for hepatic IκBα (37 kDa), TNFα (17 kDa), and total and phosphorylated c-Jun (39 kDa). There was a tendency for treatment by parity interaction (P = 0.07) for IκBα, reflecting increased (P = 0.04) IκBα abundance by rbTNFα treatment in primiparous cows (data not shown). No treatment effects (P>0.10) were observed for hepatic TNFα, c-Jun, or relative c-Jun phosphorylation. (C): Parity significantly affected hepatic IκBα (P = 0.02), TNFα (P = 0.04), and relative c-Jun phosphorylation (P = 0.04). Values are means ± SEM, n = 10–11 (A and B) or 9–24 (C).

