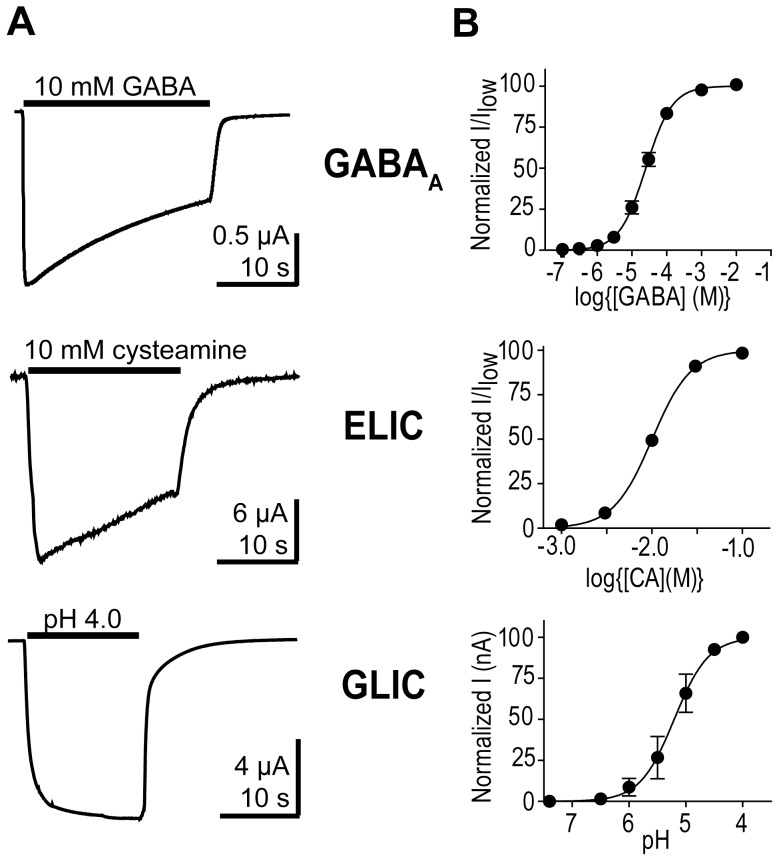
Figure 1. GABAA receptor, ELIC, and GLIC current responses measured using two-electrode voltage clamp.
A) Representative currents from the GABAA receptor, ELIC, and GLIC expressed in oocytes evoked by saturating concentrations of agonist (black bar). B) Concentration response curves for the GABAA receptor, ELIC, and GLIC. CA = cysteamine.

