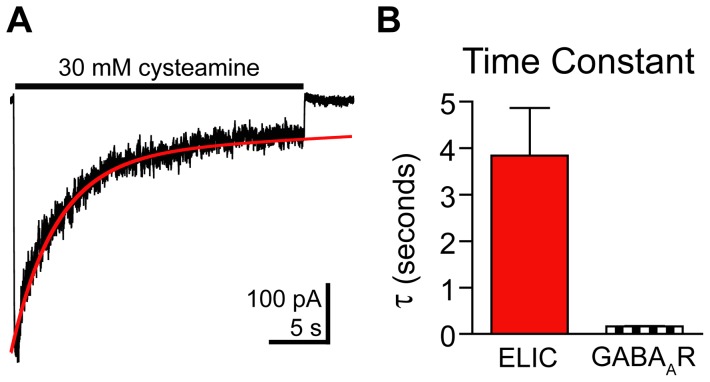
Figure 5. Macroscopic ELIC current desensitization.
A) The desensitization phase of ELIC current evoked by a 25 s pulse of 30 mM cysteamine was fit with a single-exponential function (red curve). B) The τ-desensitization for ELIC currents as measured in (A) and the τw-desensitization for GABAAR currents measured during a 1s application of 10 mM GABA are plotted. Data are mean ± SEM (ELIC: n = 4, GABAAR: n = 10).

