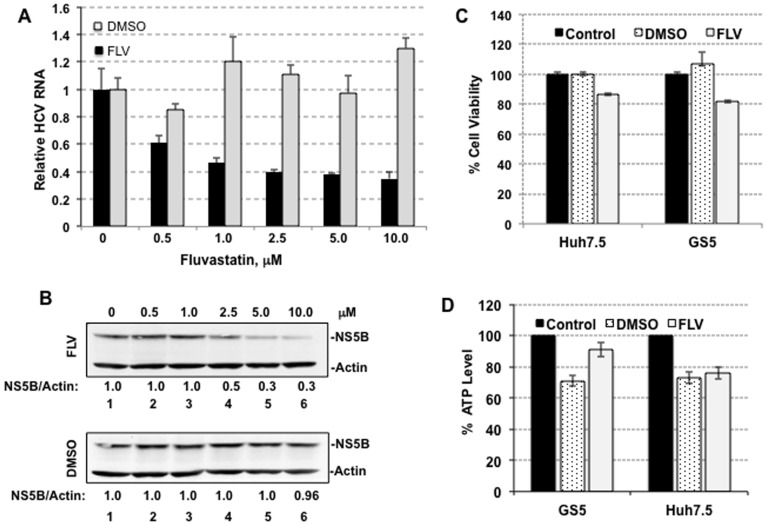
Figure 1. Inhibition of HCV replication by fluvastatin (FLV) in cell culture.
(A) Real-time RT-PCR for detection of the HCV RNA in DMSO (control, gray bar) or FLV (black bar) treated GS5 cells. These cells were first isolated by FACS using GFP channel, expanded and treated with varying amounts (0–10 µM) of FLV or similar amounts of DMSO for 48 hr. The relative HCV RNA levels in treated cells were measured in total RNA extracted and compared with untreated cells (zero control). (B) Western blot for detection of NS5B levels in FLV (lane 2 through 6, upper panel) or DMSO (lower panel) treated cells. Lane 1, untreated control. Actin, loading control. Band intensities of NS5B and actin were calculated and NS5A/actin ratio in untreated control was set as one. (C) Determination of cytotoxicity of FLV (5 µM) or DMSO for Huh7.5 and GS5 cells using cell viability assay. Control, untreated sample. (D) ATP assay for detection of metabolic status of GS5 and Huh7.5 cell lines following FLV (5 µM) or DMSO treatment. Five thousand each of the cell lines were plated in a 96-well opaque walled tissue cultures plate and ATP level was measured using luciferase-based assay kit (Promega). Each treatment was carried out in triplicates. ATP levels in the DMSO- or FLV-treated cells were compared with those of untreated (black bar, considered as 100% ATP level) cells.

