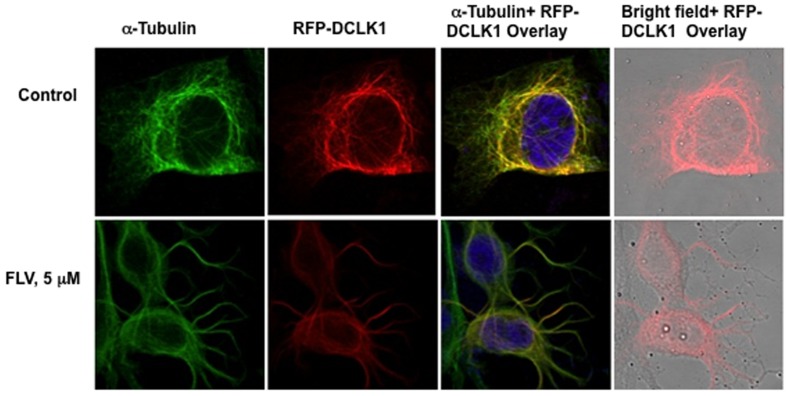
Figure 4. Effects of fluvastatin on DCLK1 overexpressing hepatoma cells.
Upper panel; α-tubulin was highlighted with Alexa Flour 647 (far red)-secondary antibody conjugate staining but pseudocolored as green in GS5 cells overexpressing red florescence protein (RFP) tagged-DCLK1 (RFP-DCLK1, red). Yellow, colocalization of RFP-DCLK1 with microtubules. Lower panel; the distribution of microtubule (green) and DCLK1 (red) in 5 µM FLV-treated RFP-DCLK1 cells. Far right, bright field image of the cells was overlaid with DCLK1 (red) to demonstrate morphological changes and re-distribution of DCLK1 into the bundled microtubules after FLV treatment. Most DCLK1 overexpressing cells showed similar distribution pattern as shown here.

