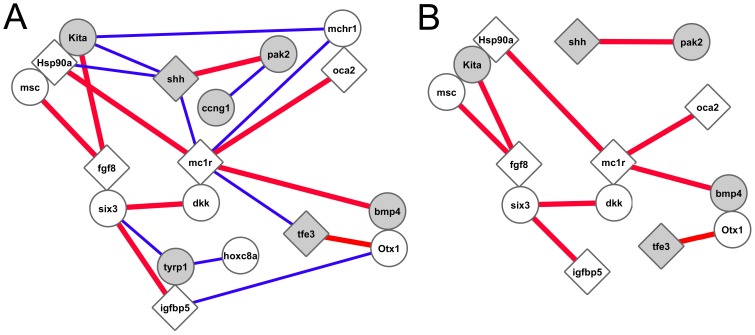
Figure 4. A network of genes (or closely linked loci) exhibiting significant epistatic interactions.
Nodes are genes and edges denote epistatic interactions significant at p<0.05 (χ2>9.5, df = 4, analysis of a 3by 3 genotype matrix). Genes depicted are candidates for cave related phenotypes. The red edges signify interactions in which the ratio of Hom/Het was significantly greater than 1.0 (χ2>3.85, df = 1). Nodes in contact with one another signify genes that are linked.

