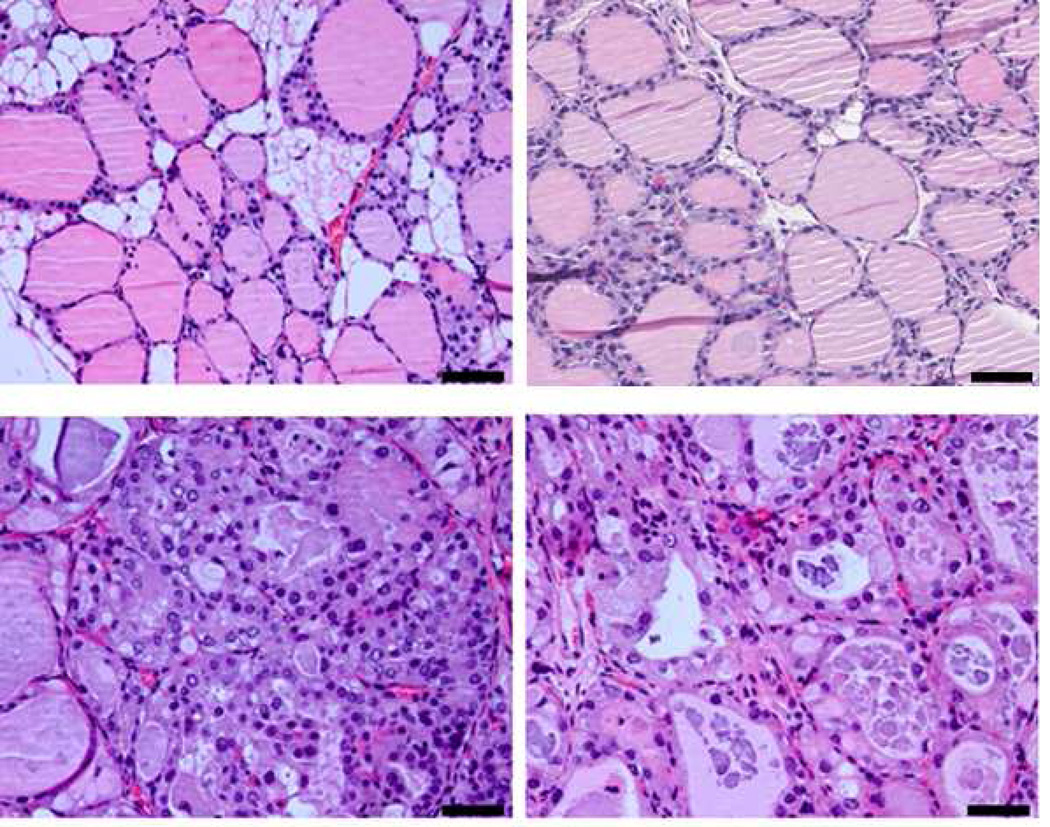
Figure 2.
High power view (40×) of: (Top left) Normal thyroid, where the round to oval follicles contain colloid material and benign fatty tissue separates groups of follicles; (top right) C-cell neoplasm; (bottom left) papillary thyroid carcinoma; and (bottom right) papillary thyroid carcinoma showing follicular pattern. The scale bar is 50 µm.

