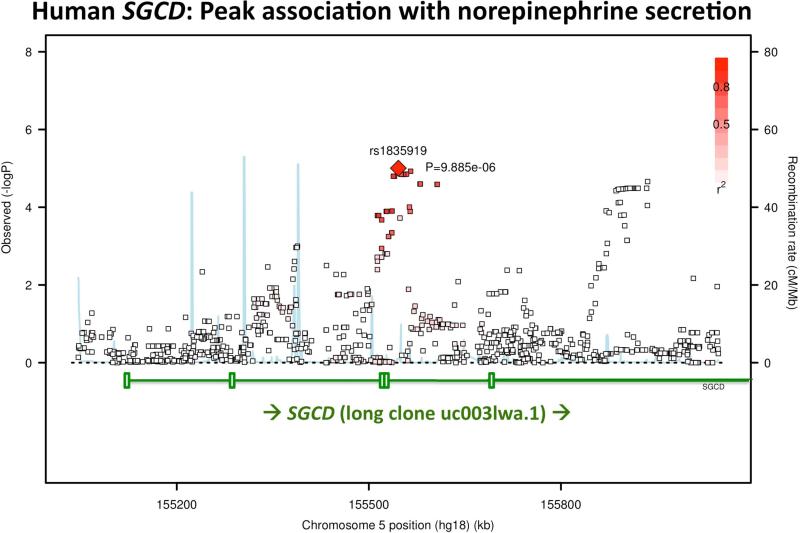
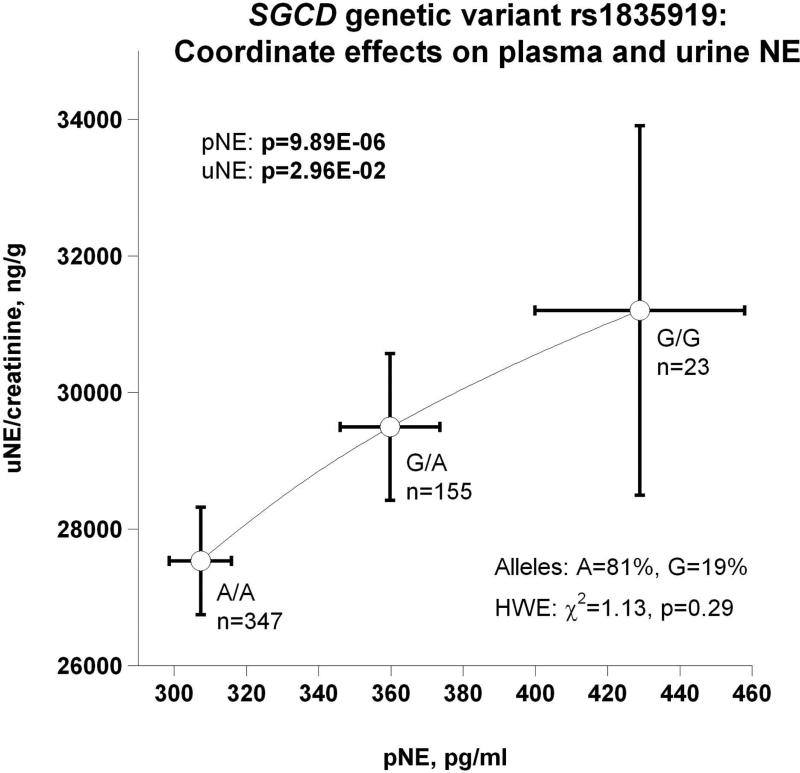
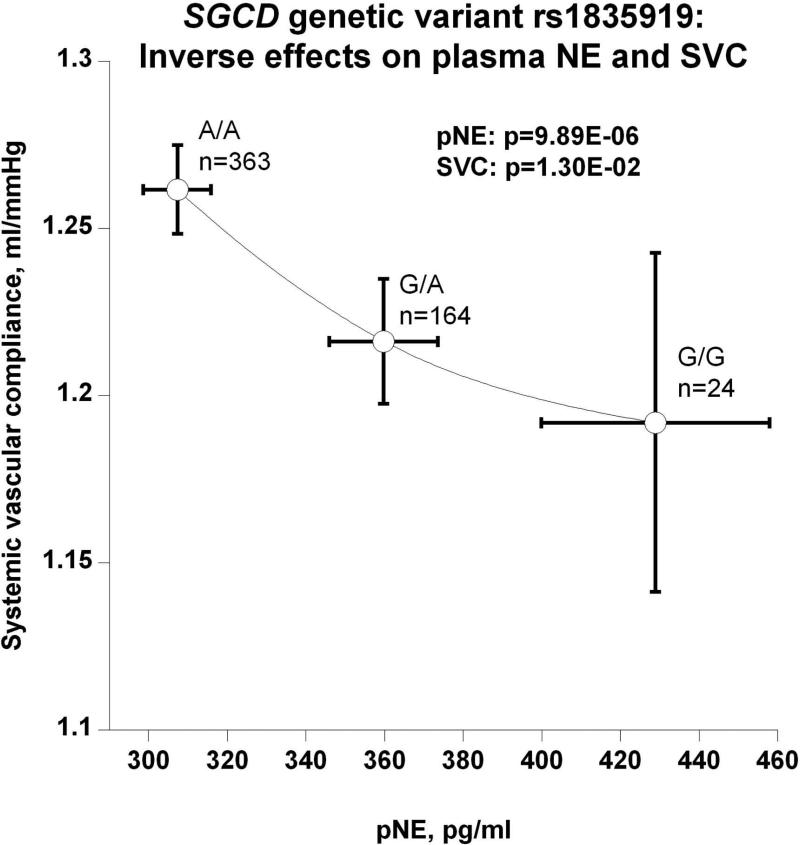
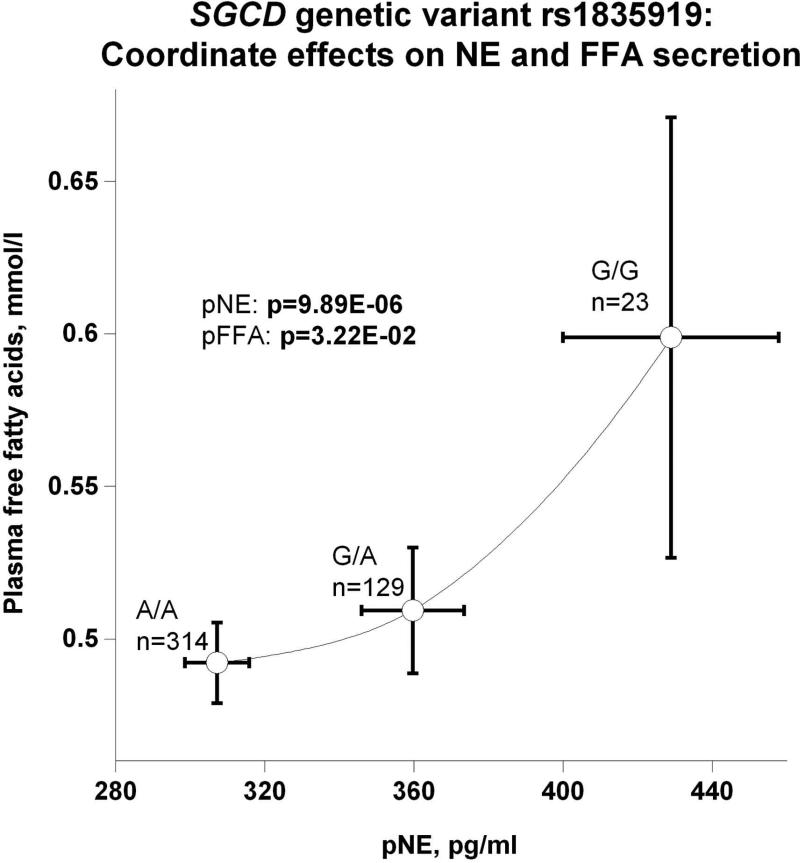
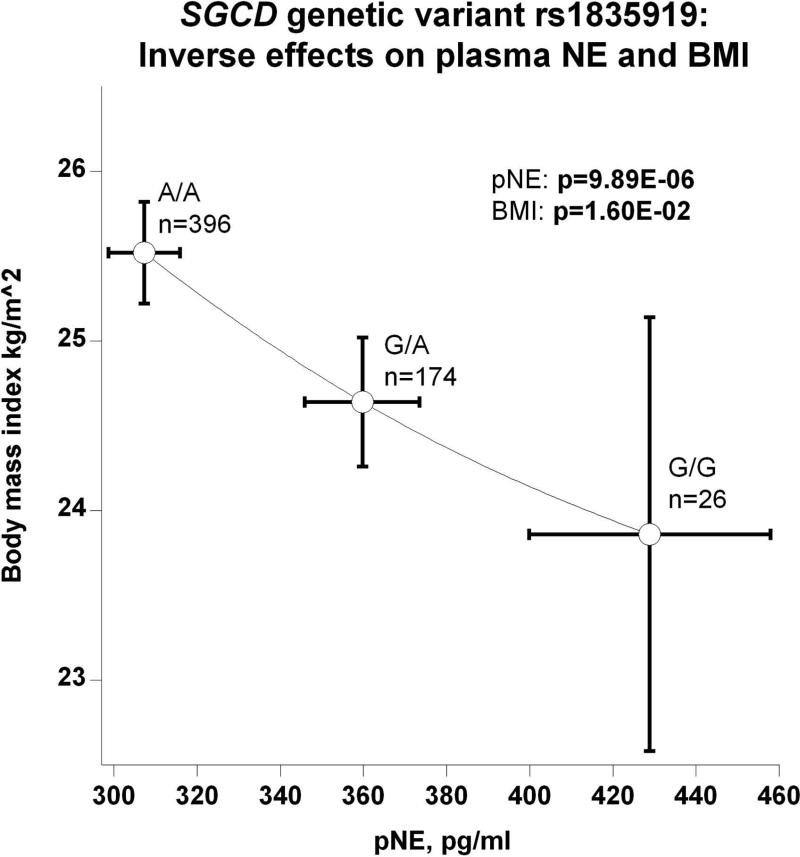
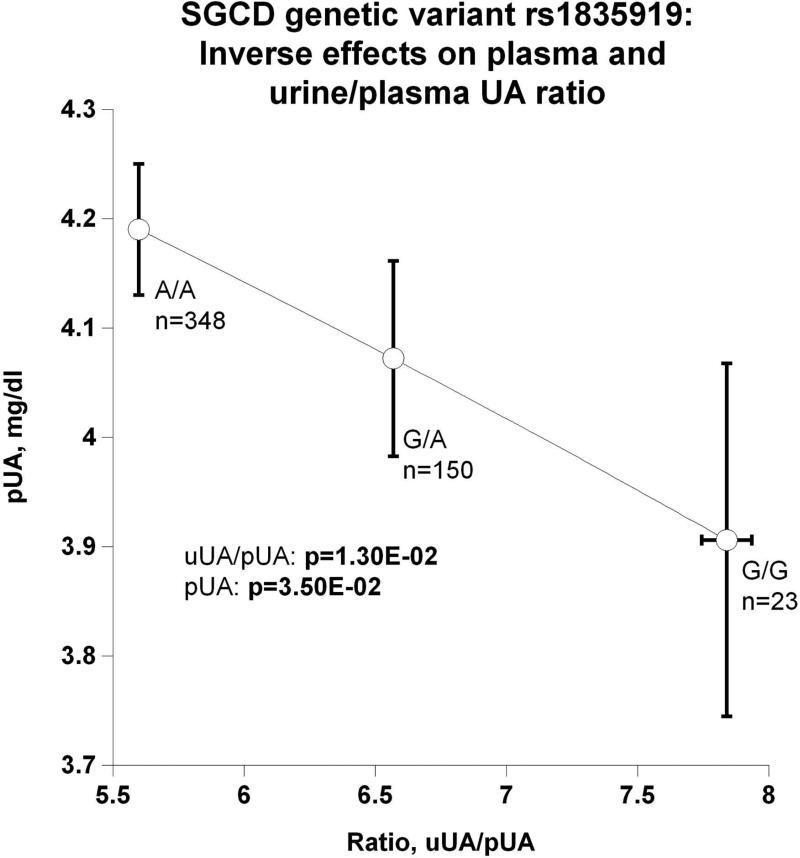
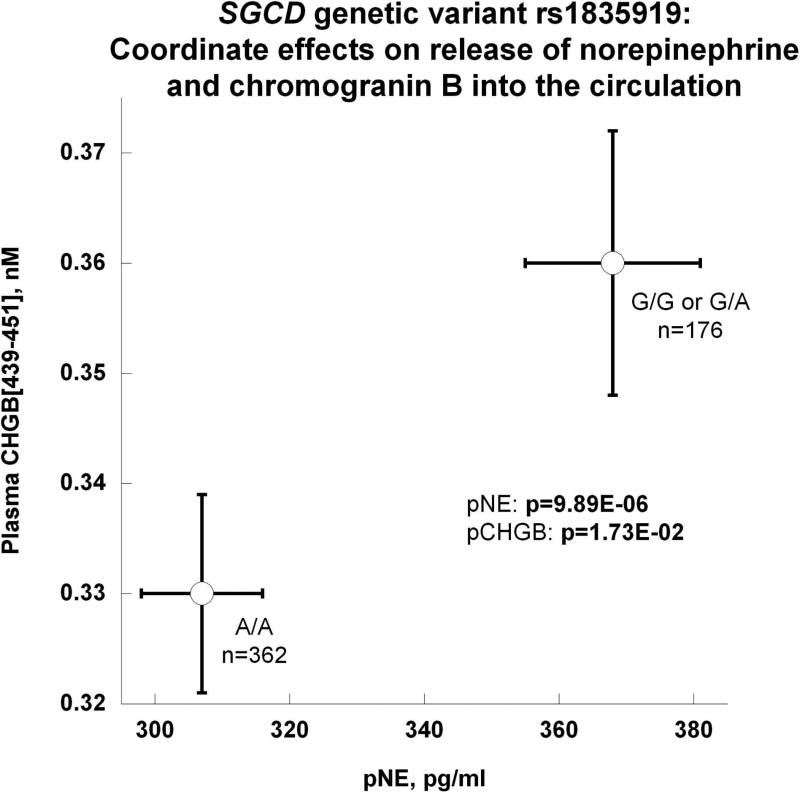
Figure 3. Genetic determination of traits by variation at the delta-sarcoglycan (SGCD) locus: Effects upon norepinephrine (NE) secretion as well as other physical, physiological, and biochemical traits.
Results are shown as mean ± SEM. Significant differences (P<0.05) are bold.
(a) Peak effect in the SGCD local region on chromosome 5q33. Local region of the Manhattan plot displayed by SNAP (SNP Annotation and Proxy Search) plot <http://www.broadinstitute.org/mpg/snap/ldplot.php>. The peak associated with NE secretion is at SGCD (intron-4, rs1835919, in long clone uc0031wa.1).
(b) Coordinate effects on plasma and urine NE (uNE indicates urine norepinephrine; uUA urine uric acid, pUA, plasma uric acid; associated allele frequency and Hardy-Weinberg equilibrium (HWE) test results displayed);
(c) Inverse effects on plasma NE (pNE) and systemic vascular compliance (SVC);
(d) Coordinate effects on pNE and plasma free fatty acids (pFFA) secretion;
(e) Inverse effects on pNE and body mass index (BMI);
(f) Inverse effects on plasma and urine/plasma uric acid (UA) ratio;
(g) Coordinate effects on release of NE and chromogranin B (CHGB [439-451]) into the circulation.

