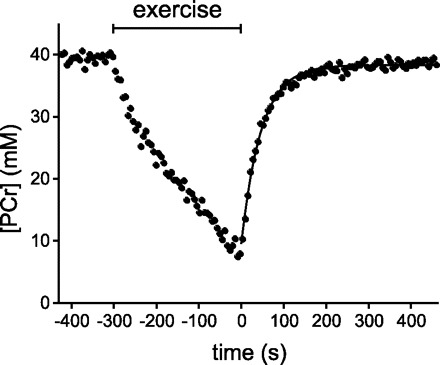
Fig. 2.

PCr concentration during rest, exercise, and recovery obtained from the corresponding data set shown in Fig. 1 (time resolution 6 s). The recovery of PCr (starting at t = 0) was fitted to a monoexponential function (solid line). The time constant for PCr recovery was 46.8 s.
