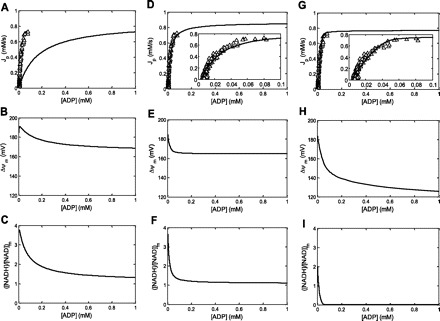
Fig. 6.

Simulations of the covariation of Jp (in mM/s), ΔΨm (in mV), and ([NADH]/[NAD])m with cyoplasmic ADP concentration (in mM) for 3 different model parameterizations. Open triangles correspond to measured in vivo ADP concentration ([ADP])-Jp covariation in an individual muscle (subject 2). A–C: default model parameterization with XANT and XDH is 0.016 and 0.269 mM/s, respectively. A: the simulated relation was kinetically characterized by unconstrained, 4-parameter curve fitting of Eq. 4 yielding fitted estimates for with Qmax, Qmin, nH, and K50 of 0.80 mM/s, −0.02 mM/s, 1.06, and 0.16 mM, respectively. D–F: fitted model parameterization I; XANT = 0.41 mM/s and θ = 1.0. XDH was kept at 0.269 mM/s. D: the simulated relation was kinetically characterized by unconstrained, 4-parameter curve fitting of Eq. 4 yielding fitted estimates for with Qmax, Qmin, nH, and K50 of 0.82 mM/s, −0.02 mM/s, 1.50, and 0.025 mM, respectively. G–I: fitted model parameterization II; XANT = 0.32 mM/s, XDH = 0.12 mM/s, and r = 3.1. G: the simulated relation was kinetically characterized by unconstrained, 4-parameter curve fitting of Eq. 4 yielding fitted estimates for with Qmax, Qmin, nH, and K50 of 0.81 mM/s, −0.02 mM/s, 2.10, and 0.023 mM, respectively.
