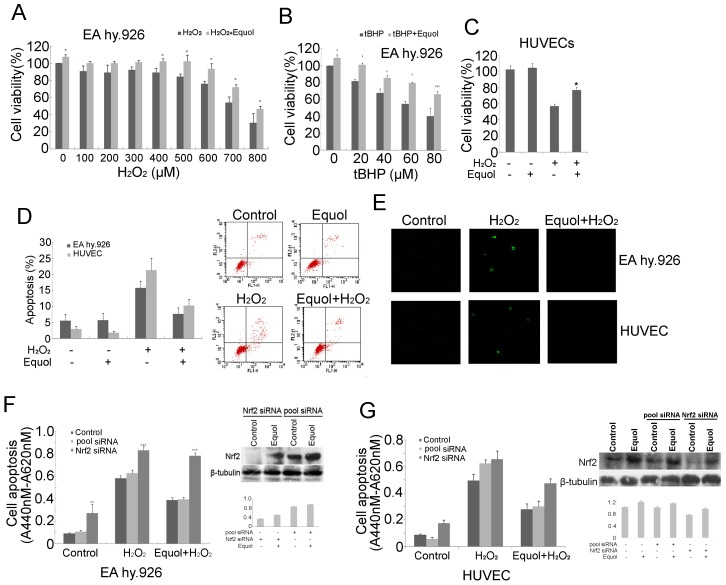
Figure 5. Efficacy of S-(-)equol in protecting against oxidative stress-induced toxicity through Nrf2.
EA.hy926 cells that were pretreated with 100S-(-)equol or sham treated for 24 h were exposed to H2O2 (100–800 µM) (A) or tBHP (20–80 µM) (B) in the presence or absence of 100 nM S-(-)equol for 24 h. HUVECs were pretreated with 100 nM S-(-)equol or sham treated for 24 h were exposed to H2O2 (100 µM) (C). Cell survival after oxidative stress was measured using a CCK-8 assay. The data are reported as the mean ± SD, n = 6. (D) Cells untreated or pretreated with 250 nM S-(-)equol for 24 h and then treated with H2O2 for another 24 h. Apoptotic cell death was detected using Annexin V-FITC and flow cytometry. The mean ± SD was calculated from three independent experiments. (E) Apoptotic cells were visualized by TUNEL. Immunoblot analysis showing Nrf2 protein in EA.hy926 cells (F, right) or HUVECs (G, right) transfected with a control or Nrf2-siRNA. Nrf2 protein was measured with immunoblot analysis using an anti-Nrf2 antibody to confirm knockdown of Nrf2 expression. (F and G) Untransfected cells and cells transfected with indicated siRNAs were incubated with 100 nM S-(-)equol for 24 h in the presence of 650 µM H2O2 or with H2O2 alone. The apoptotic index for each sample was determined using a cell death ELISA kit. The data are reported as the mean ± SD, n = 3 (*p<0.05, **p<0.01, ***p<0.001 compared with control group, # p<0.05 compared with S-(-)equol treated group).

