
Fig. 6.
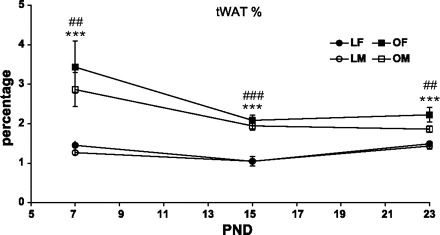
Total white adipose tissue (tWAT; expressed as %body weight) of OLETF and LETO males and females on PND7, -15, and -23. LF, LETO female; LM, LETO male; OF, OLETH female; OM, OLETF male. Data are presented as means ± SE. ***P < 0.001 for the females, ##P < 0.01, ###P < 0.001 for the males (for strain differences at each age) (n = 6–14 per group).