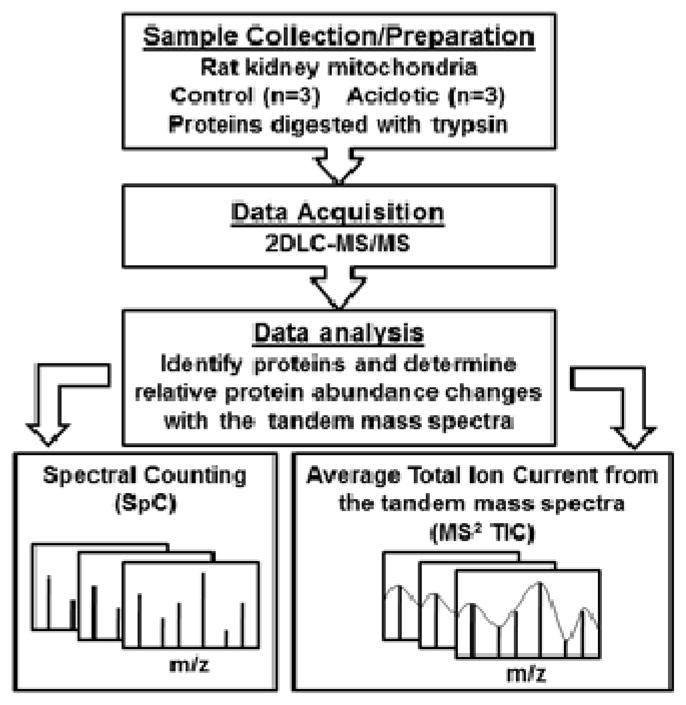
Figure 1.

The experimental workflow for proteomic analysis of rat renal mitochondrial proteins. Spectral counting (SpC) and average total ion current from the tandem mass spectra (MS2 TIC) was used to determine changes in protein abundance occurring in response to metabolic acidosis.
