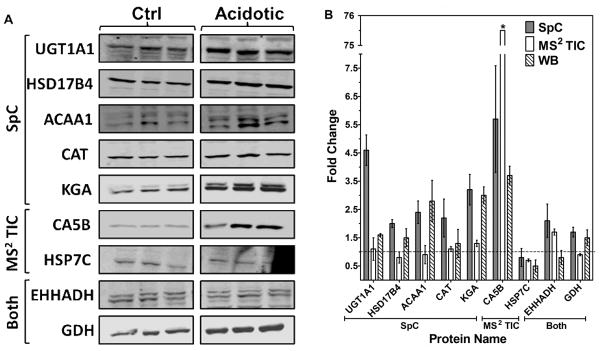
Figure 3.

Western blot analysis validating proteins found to be significantly changing in response to metabolic acidosis (p-values < 0.05) by either spectral counting (SpC), average total ion current (MS2 TIC) or both. A: The control (ctrl) and acidotic samples protein bands were imaged and quantified and each blot was normalized to a loading control. B: Fold changes from SpC, MS2 TIC and western blotting (WB). The reported data are the mean ± the S.E. of triplicate biological samples. The * indicates error not shown for CA5B MS2 TIC, ± 4.8.
