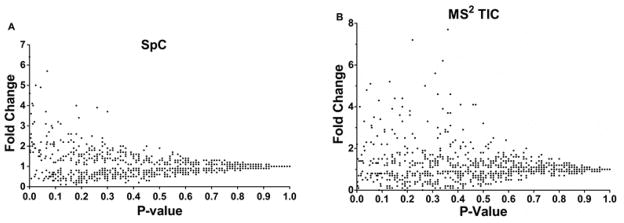
Figure 5.

P-value vs. fold change. A: The p-values from SpC analysis (x-axis) and the calculated fold changes (y-axis). B: The p-values from average MS2 TIC (x-axis) and the calculated fold changes (y-axis). Ten values are not plotted here; largest fold change was 137 for MS2 TIC.
