
Figure 6.
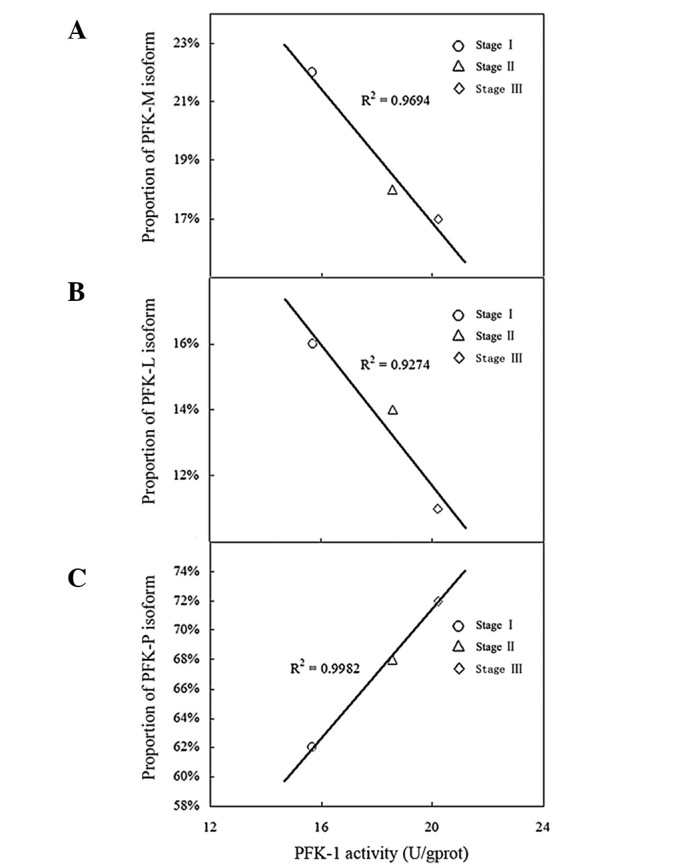
Correlation analysis between phosphofructokinase-1 (PFK-1) activity and isoenzyme patterns. Expression of (A) PFK-M and (B) PFK-L are negatively correlated with the activity of PFK-1. (C) Expression of PFK-P is positively correlated with the activity of PFK-1.