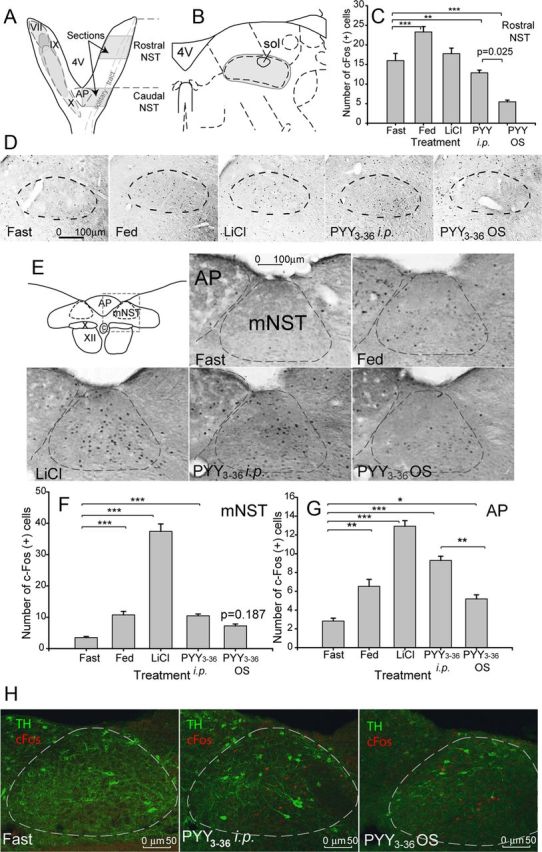
Figure 3.

Effect of PYY3–36 OS on c-fos expression in the brainstem. A, Diagram of the horizontal representation of the NST (nucleus of solitary track) in the mouse. Filled ovals indicate the overlapping termination patterns of the facial nerve (VII), the linguotonsilar branch of the glossopharyngeal nerve (IX), and the superior laryngeal branch of the vagus nerve (X). Shaded areas on the right aspect indicate the sectioned areas in the rNST and AP; sections were collected bilaterally. 4V, Fourth ventricle. B, Diagram of the coronal representation of the medial rostral area of the solitary tract. sol, Solitary tract. Filled oval indicates tabulated area. C, Tabulated values expressed as average number of c-Fos+ cells per section (n = 4). D, Shown are representative photomicrographs of the c-fos activity in the rostral part of the solitary tract in mice treated as indicated on the respective panels. E, Diagram of the coronal representation of the intermediate area of the solitary tract and representative photomicrographs of the c-fos activity. ST, Solitary tract; C, central canal; X, dorsal motor nucleus of the vagus; XII, hypoglossal nucleus. Dashed rectangle designates the areas shown as photomicrographs; dashed ovals designate areas included in the c-Fos staining count. F, Tabulated values expressed as average number of c-Fos+ cells per section in the mNST (n = 4). G, Tabulated values expressed as average number of c-Fos+ cells per section in the AP. *p ≤ 0.05, **p ≤ 0.01, ***p ≤ 0.001. H, Representative photomicrographs of the c-fos activity in mNST catecholaminergic (TH) neurons.
