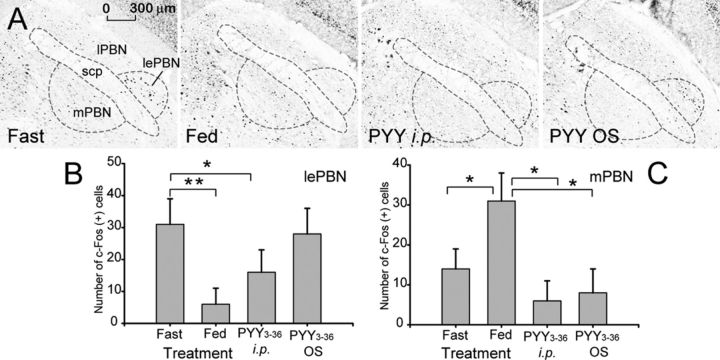
Figure 4.
Effect of PYY3–36 OS on c-fos expression in the PBN of the brainstem. A, Shown are representative photomicrographs of the c-fos activity in the PBN in mice treated as indicated on the respective panels. scp, Superior cerebellar peduncle. B, Tabulated values expressed as average number of c-Fos+ cells per section in the lePBN (n = 4). C, Tabulated values expressed as average number of c-Fos+ cells per section in the mPBN. *p ≤ 0.05, **p ≤ 0.01.

