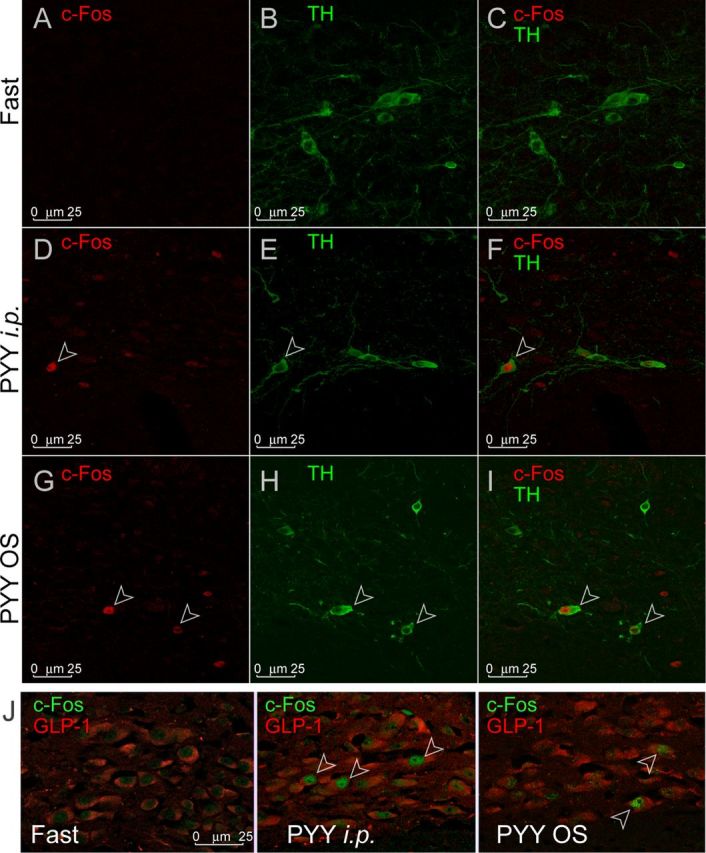
Figure 5.

c-Fos activity in NST catecholaminergic (TH) and GLPergic neurons. A, D, and G show individual channels for c-Fos. B, E, and H show individual channels for TH. C, F, and I show combined channels. Open arrowheads indicate neurons positive for both c-Fos and TH. J shows c-Fos expression (green) in the GLP-1-IR neurons (red) in the mNST under treatment conditions indicated in each panel. Open arrowheads indicate neurons positive for both c-Fos and GLP-1.
