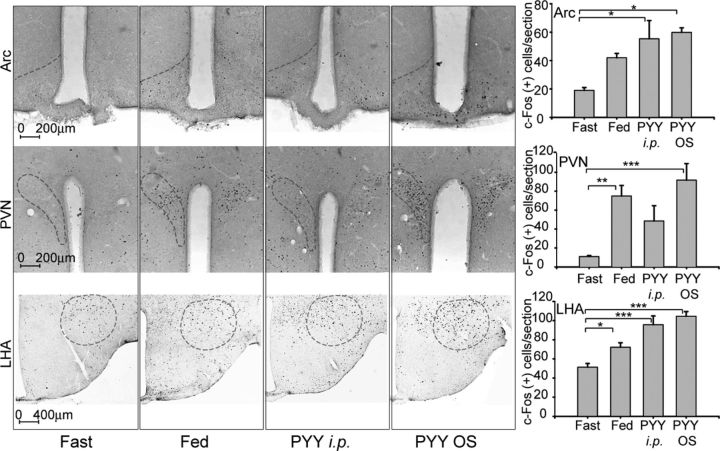
Figure 6.
Effect of PYY3–36 OS on c-fos expression in the Arc (top row), PVN (middle row), and LHA (bottom row). Dash ovals indicate areas included in the tabulations. Panels in the rightmost column show tabulated values expressed as average number of c-Fos+ cells per section (n = 4 mice per group). *p ≤ 0.05, **p ≤ 0.01, ***p ≤ 0.001.

