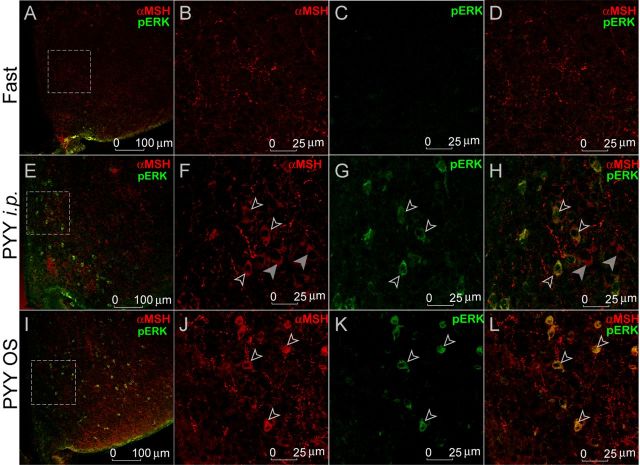
Figure 7.
Effect of PYY3–36 treatment on p-ERK1/2 activation in the Arc. A, E, and I show low-magnification images of p-ERK1/2 and α-MSH colocalization. B, F, J and C, G, K are magnified images (individual channels) of the areas outlined by a dotted rectangles in the leftmost column. D, H, and L are images from the combined channels. Open arrowheads indicate neurons expressing both p-ERK1/2 and α-MSH; filled arrowheads designate neurons expressing α-MSH only.

