
Figure 3.
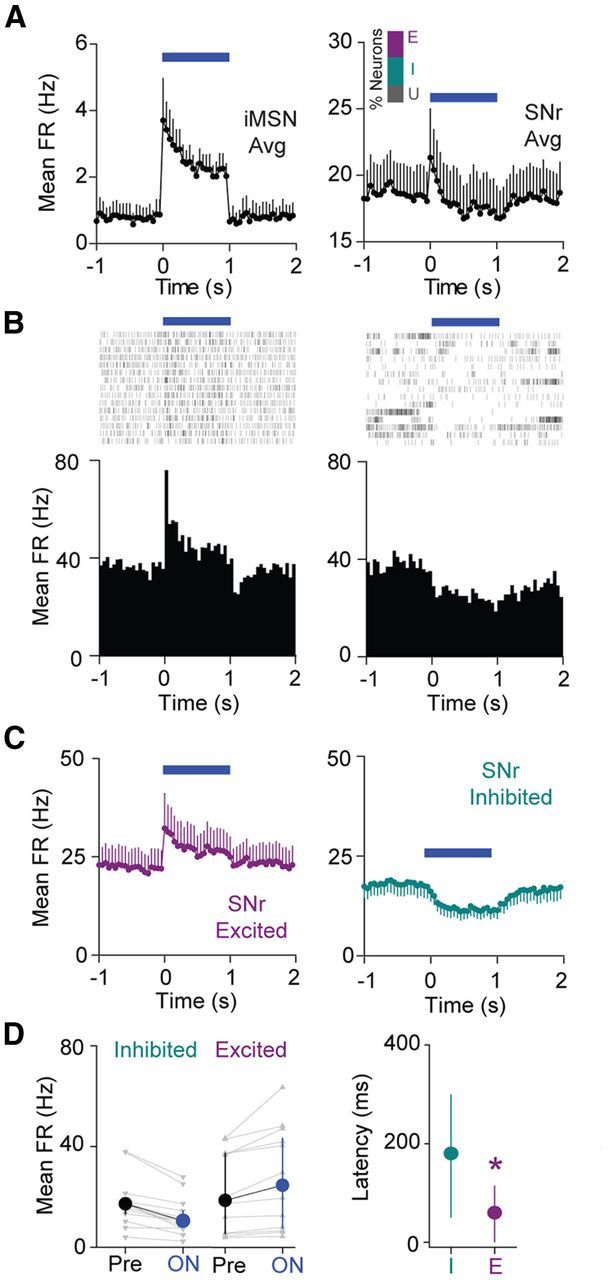
Indirect pathway activation selectively excites subsets of SNr neurons. A, Left, Average time course (±SEM) of striatal iMSN activation in response to 1 s illumination (n = 6 neurons). Right, Average time course (±SEM) of SNr neuron modulation in response to 1 s striatal illumination. Inset, Bar graph showing percentage of neurons excited (E), inhibited (I), or without significant response (U) to indirect pathway activation. B, Left, Raster plot and perievent histogram for an SNr neuron strongly excited by 1 s indirect pathway activation. Right, Raster plot and perievent histogram for an SNr neuron inhibited by 1 s indirect pathway activation. C, Left, Average time course for excited neurons (n = 12 neurons). Right, Average time course for inhibited neurons (n = 13 neurons). Error bars indicate SEM. Time is binned at 50 ms. D, Left, Changes in mean FR from Pre to ON conditions for inhibited cells and excited cells. Individual cells are shown in gray, and the group medians (±IQR) are shown in black or blue. Right, Median (±IQR) latencies to a significant change in FR for both inhibited and excited cell populations (n = 12 excited, n = 13 inhibited).