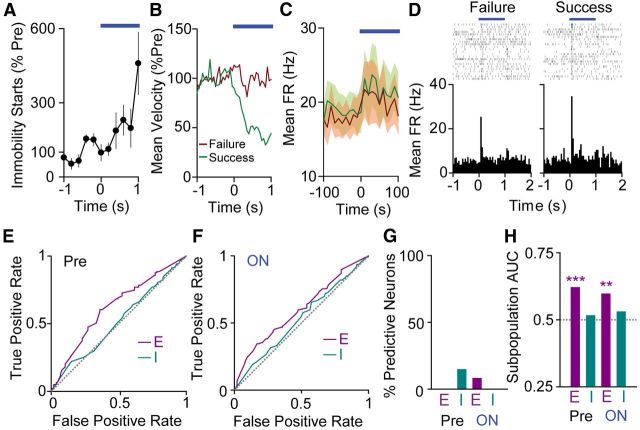
Figure 5.
Excited SNr neurons predict motor suppression. A, Mean (±SEM) immobility starts per animal (n = 4) for 1 s iMSN activation. B, Group mean normalized velocity for all trials that do not elicit an immobility start (“failures”; red) and those that do elicit an immobility start (“successes”; green). C, Population mean FR for failure and success trials (n = 33 neurons). SEM shaded in corresponding colors. D, Raster plots and perievent histograms for the same SNr neuron in failure trials (left) and success trials (right). E, ROC curves for excited (E; n = 12 neurons) and inhibited (I; n = 13 neurons) subpopulations in the Pre period. The gray line is defined by the equation true positive rate = false positive rate and represents lack of discrimination between behavioral states. F, ROC curves for excited (E; n = 12 neurons) and inhibited (I; n = 13 neurons) subpopulations in the ON period. G, Percentage of individual neurons with significant discriminability for behavioral outcome in the Pre and ON periods (E, excited, n = 12 neurons; I, inhibited, n = 13 neurons). H, Area under the ROC curve (AUC) for excited (E; n = 12 neurons) and inhibited (I; n = 13 neurons) subpopulation responses in the Pre and ON periods. The gray dashed line represents AUC = 0.5.

