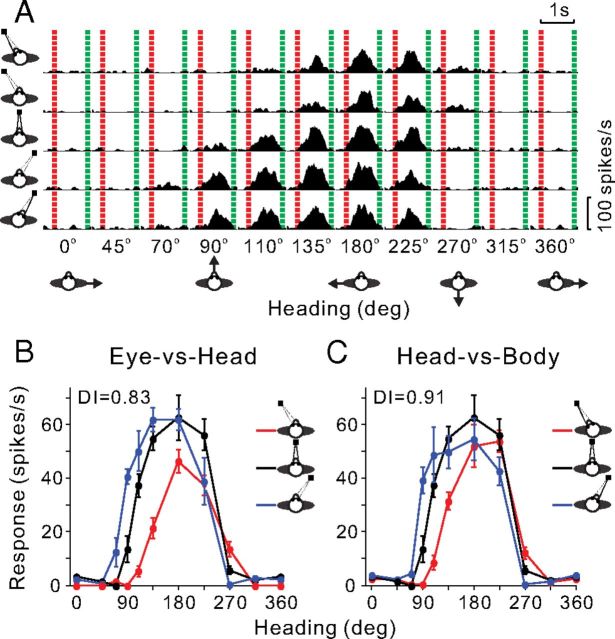
Figure 1.
Heading tuning of an example VIP neuron at different eye/head positions. A, PSTHs of the responses of the neuron to optic flow stimuli are shown for all 50 stimulus conditions tested, all permutations of 10 directions of translation (x-axis) and 5 combinations of [eye, head] positions: [0°, −20°], [−20°, 0°], [0°, 0°], [20°, 0°], [0°, 20°] (rows). The red and green dashed lines represent the start and end of the motion stimulus. B, Tuning curves from the Eye-vs-Head condition. The three tuning curves show mean firing rate (±SEM) as a function of heading for the three combinations of [eye, head] position ([−20°, 0°], [0°, 0°], [20°, 0°]), as indicated by the red, black, and blue curves, respectively. C, Tuning curves from the Head-vs-Body condition for the three combinations of [eye, head] position ([0°, −20°], [0°, 0°], [0°, 20°]). The format is the same as in B.

