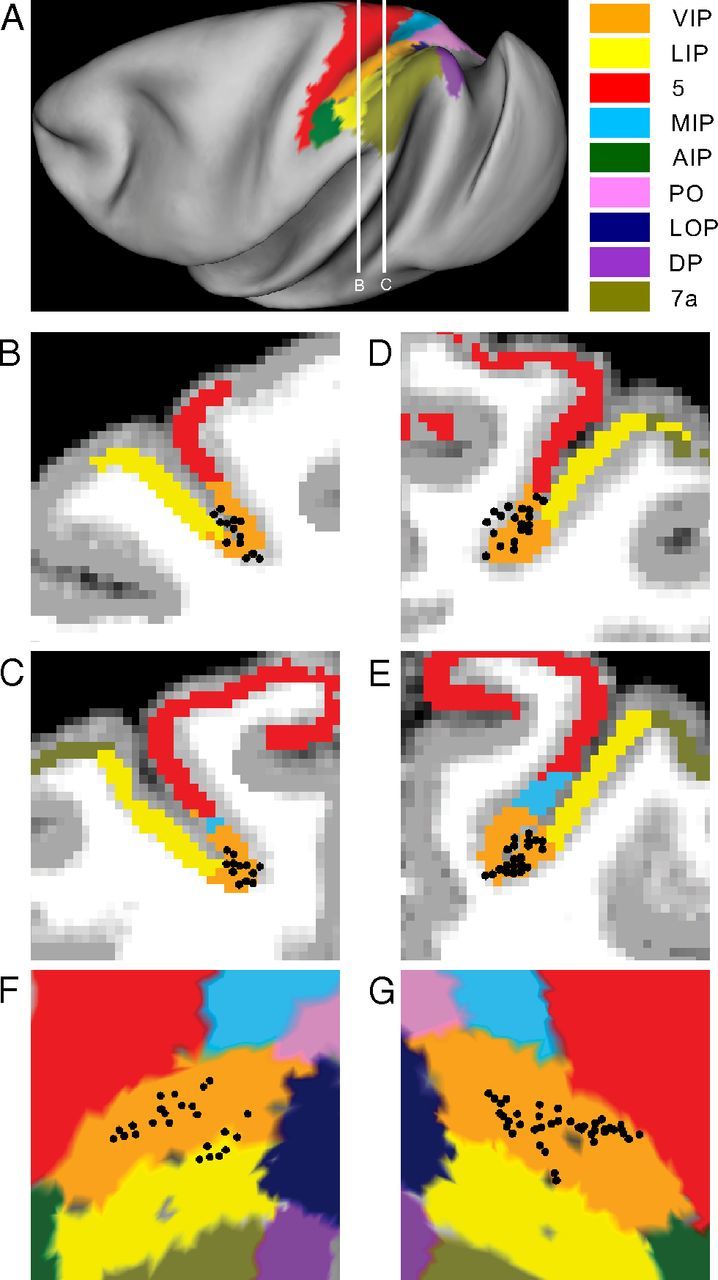
Figure 6.

Anatomical localization of recording sites. A, Inflated cortical surface illustrating the major subareas of the parietal cortex (color coded) in the left hemisphere of monkey Q, as well as the locations (white lines) of the coronal sections drawn in B and C. B, C, Coronal sections from the left hemisphere of monkey Q, spaced 2.5 mm apart. D, E, Corresponding coronal sections from the right hemisphere of monkey E. Recording locations (black circular symbols) of neurons that were located within ±1.25 mm of each section were projected onto that section. Only neurons that met the criteria to be included in our DI analyses of heading tuning are shown here (animal Q, n = 24 neurons; animal E, n = 42 neurons). Because only one neuron was recorded from each of the other two hemispheres, they are not illustrated here. F, G, Anatomical localization of recorded neurons on flat maps of the left hemisphere of monkey Q and the right hemisphere of monkey E, respectively. Different functional brain areas are color coded, as indicated in the legend. The four corners of each panel (top left, bottom left, bottom right, top right) indicate the approximate orientation of the flat map relative to the surface of a hemisphere, which is medial, anterior, lateral, posterior in F and posterior, lateral, anterior, medial in G.
