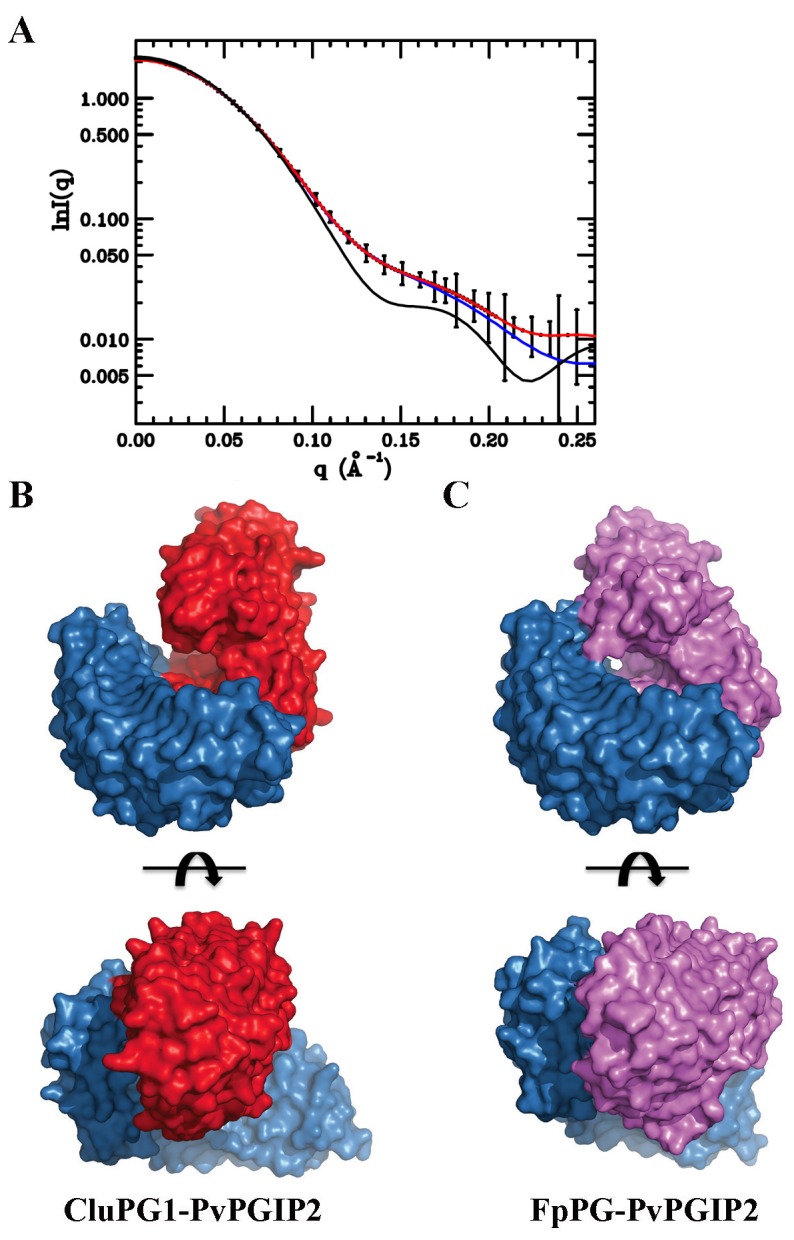
Figure 2. Comparative analysis between the CluPG1-PvPGIP2 and FpPG-PvPGIP2 complexes.

A, The CluPG1-PvPGIP2 (red) and FpPG-PvPGIP2 scattering patterns (black) are reported together with the profile by the SASREF program for the CluPG1-PvPGIP2 complex (blue), for comparison. B, Surface representation of the complex formed by CluPG1 (in red) and PvPGIP2 (in blue). C, Surface representation of the complex formed by FpPG (in magenta) and PvPGIP2 (in blue). PvPGIP2 contacts both edges of the active site cleft in FpPG while only one edge is contacted in CluPG1. Two orthogonal viewpoints are reported.
