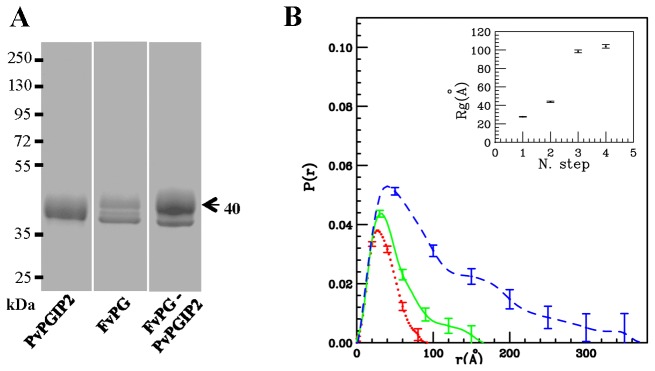
Figure 4. Analysis of the complex formed by FvPG and PvPGIP2.

A, SDS-PAGE analysis of the FvPG-PvPGIP2 cross-linked complex. The single proteins are also reported. B, Calculated pair distribution functions of the first three SAXS patterns collected for the FvPG-PvPGIP2 complex; red dot-line, green continuous-line and blue dash-line correspond to three consecutive data sets (interval times about 20 h), respectively. In the inset, the Rg values of four consecutive data sets are shown.
