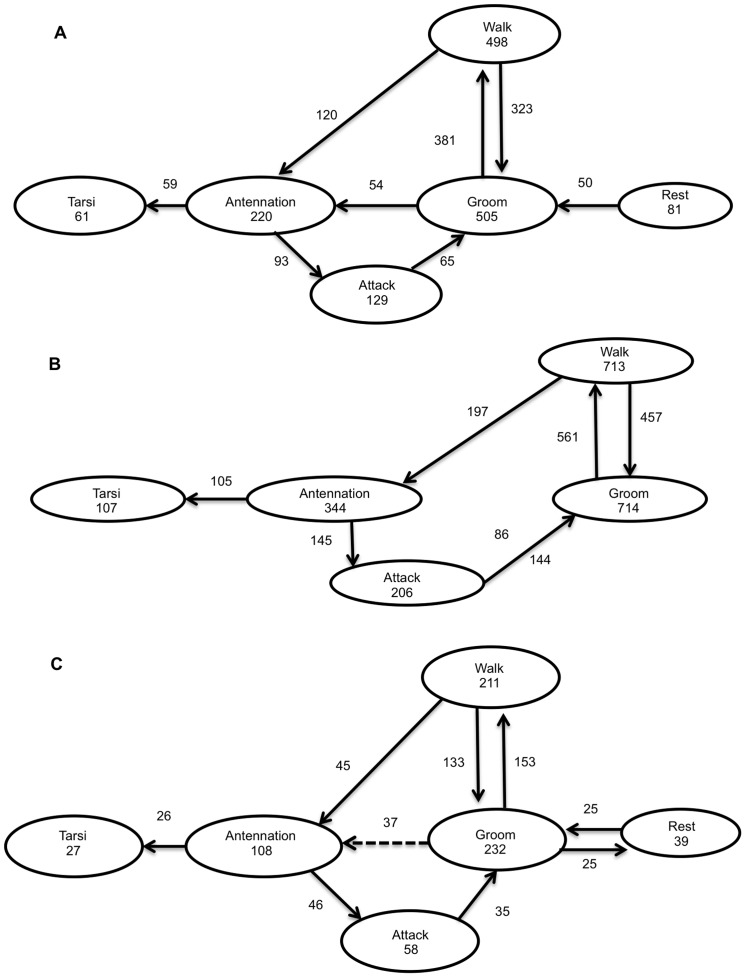
Figure 3. Flow diagrams showing the behavioral sequence of E. eremicus under IGP risk (no choice bioassay).
Three treatments are illustrated: (A) control leaflets, (B) leaflets with previous exposure to predator and, (C) leaflets with presence of predator. Boxes represent behavioral acts, and numbers inside the boxes are behavioral repetitions. Solid arrows represent transitions significantly different from expected (non-random) transitions, and dashed arrows represent transitions not significantly different from expected (random) transitions. Numbers next to arrows represent the numbers of transitions. Transitions with a relative frequency lower than 3% are not shown.

