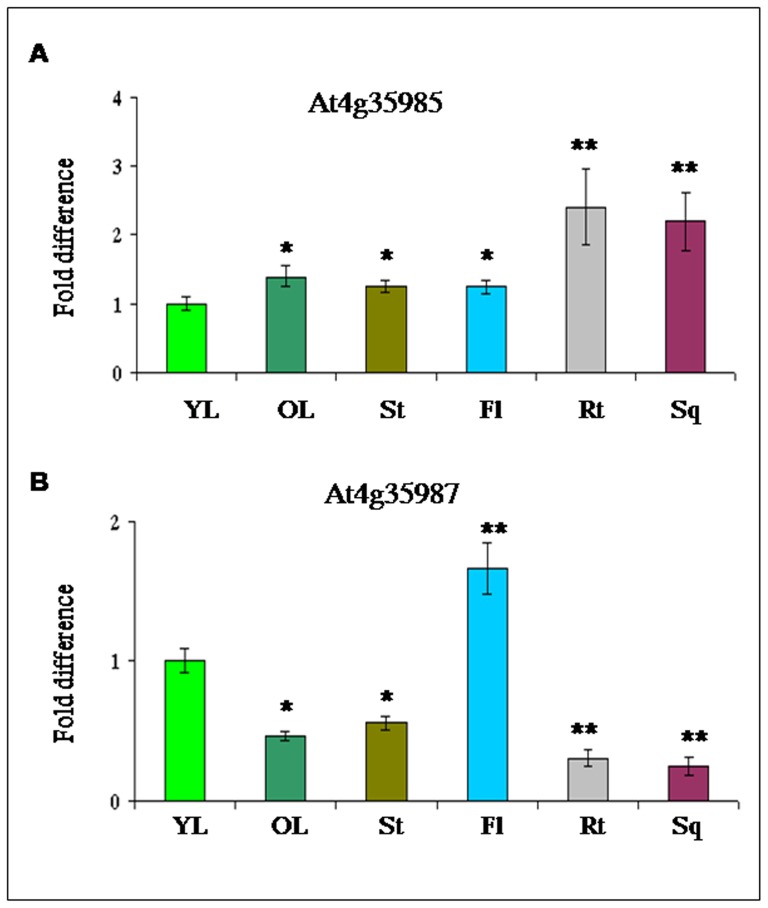
Figure 2. Expression profiling (relative transcript) of Arabidopsis At4g35985 and At4g35987 genes in vegetative and reproductive tissues.
(A–B) Relative transcript abundance of two Arabidopsis thaliana genes, At4g35985 (A) and At4g35987 (B) detected in young leaf (YL), older leaf (OL), stem (St), flower (Fl), root (Rt) and immature silique (Sq) tissue by qRT-PCR. Data represent average fold difference of transcript ± SD of three independent experiments with four replicates. Asterisk and double asterisks indicate the significant deviation from young leaf (YL) at P<0.05 and P<0.01, respectively using Student's t test for comparison between YL and other tissues separately for both the genes.

